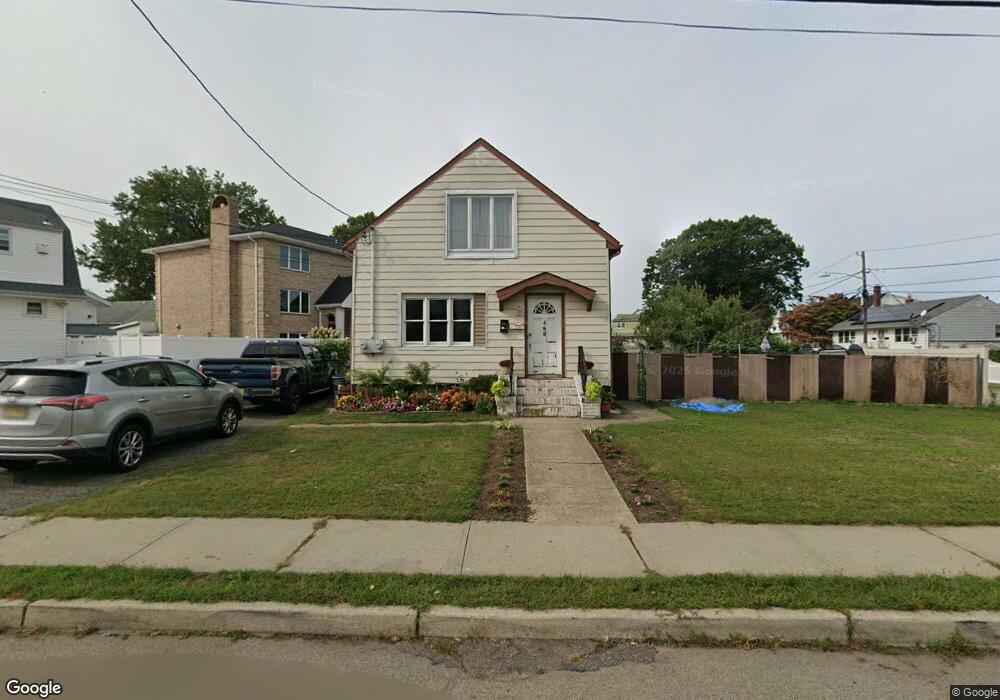
469 Jackson Ave Hackensack, NJ 07601
Estimated Value: $579,669 - $995,000
Studio
--
Bath
1,614
Sq Ft
$466/Sq Ft
Est. Value
About This Home
This home is located at 469 Jackson Ave, Hackensack, NJ 07601 and is currently estimated at $752,417, approximately $466 per square foot. 469 Jackson Ave is a home located in Bergen County with nearby schools including Hackensack High School, Academy of Greatness & Excellence, and George Washington School.
Ownership History
Date
Name
Owned For
Owner Type
Purchase Details
Closed on
Oct 28, 2013
Sold by
469 Jackson Avenue Llc
Bought by
Salto Luis and Salto Luz
Current Estimated Value
Home Financials for this Owner
Home Financials are based on the most recent Mortgage that was taken out on this home.
Original Mortgage
$194,750
Interest Rate
4.36%
Mortgage Type
FHA
Purchase Details
Closed on
Jun 22, 2000
Sold by
Davi Calogero and Davi Maria
Bought by
469 Jackson Avenue Llc
Purchase Details
Closed on
Mar 23, 2000
Sold by
Davi Calogero and Davi Maria
Bought by
Davi Calogero and Davi Maria
Purchase Details
Closed on
Dec 21, 1995
Sold by
Moreno August
Bought by
Davi Cologero and Davi Maria
Home Financials for this Owner
Home Financials are based on the most recent Mortgage that was taken out on this home.
Original Mortgage
$40,000
Interest Rate
7.16%
Create a Home Valuation Report for This Property
The Home Valuation Report is an in-depth analysis detailing your home's value as well as a comparison with similar homes in the area
Home Values in the Area
Average Home Value in this Area
Purchase History
| Date | Buyer | Sale Price | Title Company |
|---|---|---|---|
| Salto Luis | $205,000 | -- | |
| 469 Jackson Avenue Llc | -- | -- | |
| Davi Calogero | -- | -- | |
| Davi Cologero | $135,000 | -- |
Source: Public Records
Mortgage History
| Date | Status | Borrower | Loan Amount |
|---|---|---|---|
| Previous Owner | Salto Luis | $194,750 | |
| Previous Owner | Davi Cologero | $40,000 |
Source: Public Records
Tax History
| Year | Tax Paid | Tax Assessment Tax Assessment Total Assessment is a certain percentage of the fair market value that is determined by local assessors to be the total taxable value of land and additions on the property. | Land | Improvement |
|---|---|---|---|---|
| 2025 | $10,241 | $335,100 | $163,400 | $171,700 |
| 2024 | $9,648 | $335,100 | $163,400 | $171,700 |
| 2023 | $9,163 | $335,100 | $163,400 | $171,700 |
| 2022 | $9,163 | $327,000 | $156,400 | $170,600 |
| 2021 | $8,885 | $264,600 | $129,200 | $135,400 |
| 2020 | $8,756 | $264,600 | $129,200 | $135,400 |
| 2019 | $8,762 | $261,000 | $127,700 | $133,300 |
| 2018 | $8,785 | $257,400 | $125,200 | $132,200 |
| 2017 | $8,667 | $253,800 | $123,700 | $130,100 |
| 2016 | $8,334 | $246,700 | $118,700 | $128,000 |
| 2015 | $8,684 | $248,100 | $156,200 | $91,900 |
| 2014 | $8,242 | $248,100 | $156,200 | $91,900 |
Source: Public Records
Map
Nearby Homes
- 467 Hudson St
- 418 Taylor Ave
- 9 Vreeland Ave Unit 3A
- 337 Hudson St
- 468 Liberty St Unit 201
- 460 Liberty St Unit 205
- 462 Liberty St Unit 462A Unit 101
- 462C Liberty St Unit 312
- 468a Liberty St Unit 101
- 85 Grove St
- 151 4th St
- 221 4th St
- 333 Liberty St Unit 15
- 333 Liberty St Unit 4
- 39 Summit St
- 115 River Rd
- 53 Park St
- 23 Grand St
- 12 Brandt St
- 114 Hackensack Ave
- 475 Jackson Ave
- 51 Jay St
- 457 Jackson Ave Unit 1
- 457 Jackson Ave Unit 59
- 55 Jay St
- 470 Jackson Ave
- 466 Jackson Ave Unit 2
- 466 Jackson Ave Unit 1
- 466 Jackson Ave
- 50 Jay St Unit 52
- 472 Jackson Ave
- 472 Jackson Ave Unit 2
- 462 Jackson Ave Unit 2
- 462 Jackson Ave
- 52 Worth St
- 58 Jay St Unit 2nd fl
- 58 Jay St
- 453 Jackson Ave
- 476 Jackson Ave
- 458 Jackson Ave
Your Personal Tour Guide
Ask me questions while you tour the home.