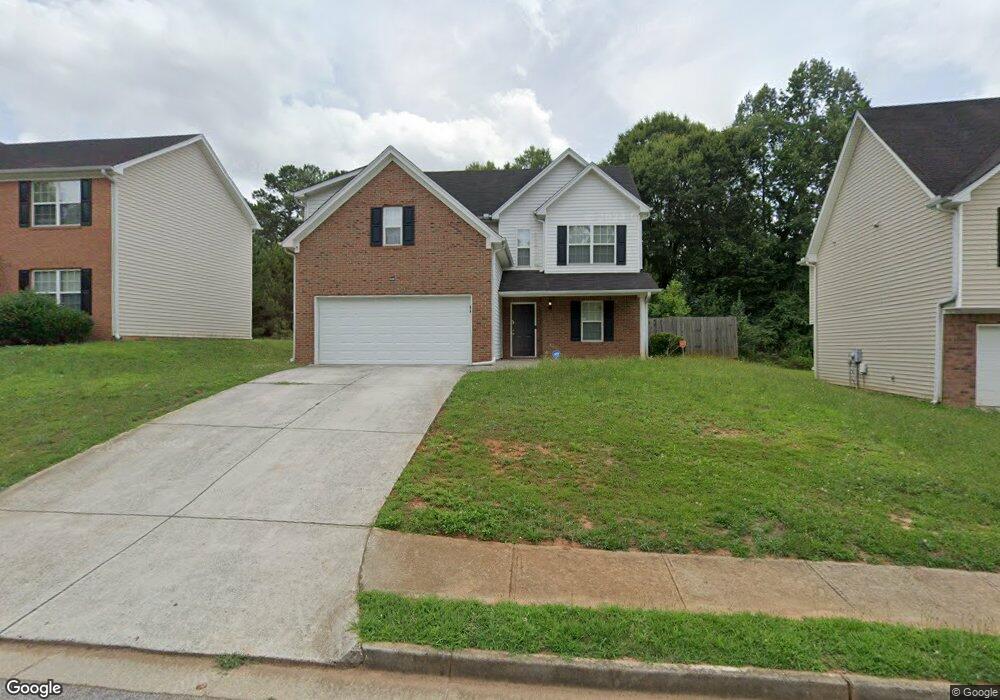
469 Luke Ct Jonesboro, GA 30238
Estimated Value: $240,697 - $267,000
4
Beds
3
Baths
1,980
Sq Ft
$129/Sq Ft
Est. Value
About This Home
This home is located at 469 Luke Ct, Jonesboro, GA 30238 and is currently estimated at $255,424, approximately $129 per square foot. 469 Luke Ct is a home located in Clayton County with nearby schools including Kemp Primary School, Kemp Elementary School, and Pointe South Middle School.
Ownership History
Date
Name
Owned For
Owner Type
Purchase Details
Closed on
Apr 9, 2025
Sold by
Home Sfr Borrower Iii Llc
Bought by
Fyr Sfr Borrower Llc
Current Estimated Value
Purchase Details
Closed on
Jun 29, 2017
Sold by
Jeff 1 Llc
Bought by
Home Sfr Borrower Iii Llc and C/O Altisource Asset Managemen
Home Financials for this Owner
Home Financials are based on the most recent Mortgage that was taken out on this home.
Original Mortgage
$87,803,400
Interest Rate
3.94%
Mortgage Type
Purchase Money Mortgage
Purchase Details
Closed on
Jun 7, 2016
Sold by
Willis Teona S
Bought by
Jeff 1 Llc
Purchase Details
Closed on
Jan 21, 2011
Sold by
Bear Stearns I Llc 2006-He3
Bought by
Findobact Holdings Corp
Home Financials for this Owner
Home Financials are based on the most recent Mortgage that was taken out on this home.
Original Mortgage
$70,000
Interest Rate
4.79%
Mortgage Type
New Conventional
Purchase Details
Closed on
Nov 2, 2010
Sold by
Howard April N
Bought by
Bear Stearns I Llc 2006-He3
Purchase Details
Closed on
Nov 30, 2005
Sold by
Luke Contracting Inc
Bought by
Howard April N
Home Financials for this Owner
Home Financials are based on the most recent Mortgage that was taken out on this home.
Original Mortgage
$154,780
Interest Rate
9.88%
Mortgage Type
New Conventional
Create a Home Valuation Report for This Property
The Home Valuation Report is an in-depth analysis detailing your home's value as well as a comparison with similar homes in the area
Home Values in the Area
Average Home Value in this Area
Purchase History
| Date | Buyer | Sale Price | Title Company |
|---|---|---|---|
| Fyr Sfr Borrower Llc | -- | -- | |
| Home Sfr Borrower Iii Llc | $259,261 | -- | |
| Jeff 1 Llc | $76,000 | -- | |
| Findobact Holdings Corp | $44,500 | -- | |
| Bear Stearns I Llc 2006-He3 | $51,636 | -- | |
| Howard April N | $154,800 | -- |
Source: Public Records
Mortgage History
| Date | Status | Borrower | Loan Amount |
|---|---|---|---|
| Previous Owner | Home Sfr Borrower Iii Llc | $87,803,400 | |
| Previous Owner | Findobact Holdings Corp | $70,000 | |
| Previous Owner | Howard April N | $154,780 |
Source: Public Records
Tax History Compared to Growth
Tax History
| Year | Tax Paid | Tax Assessment Tax Assessment Total Assessment is a certain percentage of the fair market value that is determined by local assessors to be the total taxable value of land and additions on the property. | Land | Improvement |
|---|---|---|---|---|
| 2025 | $3,094 | $79,800 | $9,600 | $70,200 |
| 2024 | $3,151 | $79,800 | $9,600 | $70,200 |
| 2023 | $2,947 | $80,560 | $9,600 | $70,960 |
| 2022 | $2,187 | $54,760 | $9,600 | $45,160 |
| 2021 | $2,005 | $49,800 | $9,600 | $40,200 |
| 2020 | $1,792 | $43,862 | $9,600 | $34,262 |
| 2019 | $1,833 | $44,226 | $9,600 | $34,626 |
| 2018 | $1,808 | $43,612 | $9,600 | $34,012 |
| 2017 | $1,275 | $30,400 | $9,600 | $20,800 |
| 2016 | $1,222 | $39,102 | $9,600 | $29,502 |
| 2015 | $1,215 | $0 | $0 | $0 |
| 2014 | $1,220 | $39,697 | $12,000 | $27,697 |
Source: Public Records
Map
Nearby Homes
- 9342 Thomas Rd
- 9383 Woodknoll Way Unit 4
- 316 River Chase Dr
- 9404 Bogey Ct
- 345 Staten St
- 9138 Sunset Dr Unit 3
- 273 Martin Dr
- 22 Fairview Dr
- 296 Country Club Dr
- 556 Country Greens Dr
- 299 Country Club Dr
- 237 Country Club Dr
- 9181 Welch Ct
- 9409 Forest Knoll Dr
- 259 Independence Dr Unit 4
- 9404 Cypress Ln
- 288 Country Club Dr
- 281 Willow Springs Dr
- 254 Country Club Dr
- 337 Independence Dr
- 463 Luke Ct
- 475 Luke Ct
- 457 Luke Ct
- 481 Luke Ct
- 9265 Forest Knoll Dr
- 9261 Forest Knoll Dr
- 9269 Forest Knoll Dr
- 451 Luke Ct
- 9255 Thomas Rd
- 487 Luke Ct
- 9257 Forest Knoll Dr
- 9273 Forest Knoll Dr
- 486 Luke Ct
- 493 Luke Ct
- 9237 Thomas Rd
- 9277 Forest Knoll Dr
- 9253 Forest Knoll Dr
- 492 Luke Ct
- 9303 Forest Knoll Ct Unit 1
- 499 Luke Ct