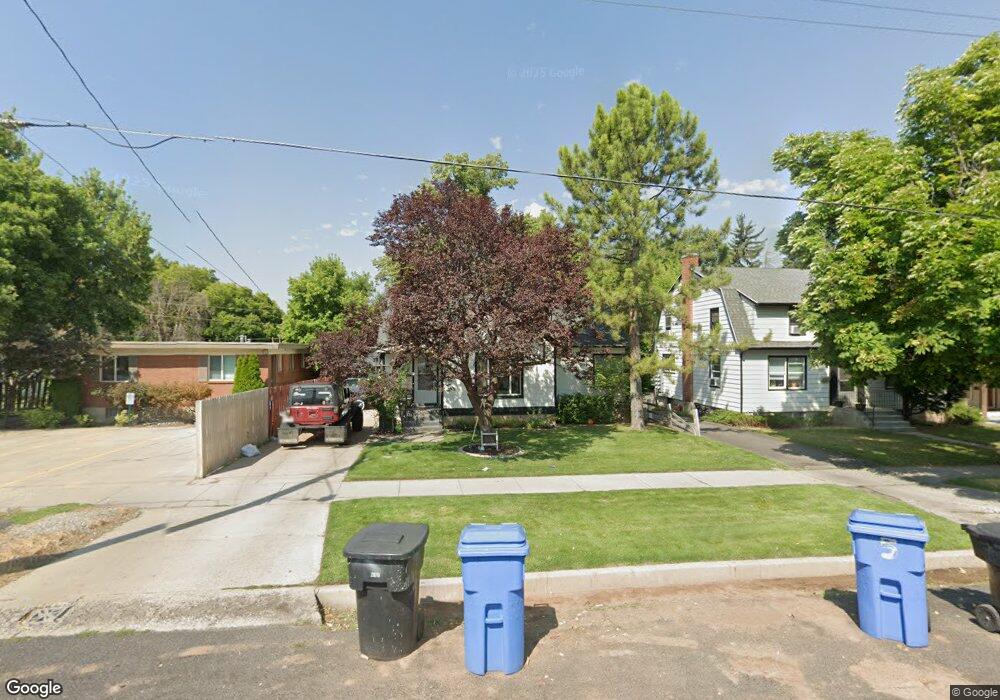
469 N 400 E Logan, UT 84321
Adams NeighborhoodEstimated Value: $383,000 - $790,000
5
Beds
2
Baths
2,088
Sq Ft
$238/Sq Ft
Est. Value
About This Home
This home is located at 469 N 400 E, Logan, UT 84321 and is currently estimated at $496,317, approximately $237 per square foot. 469 N 400 E is a home located in Cache County with nearby schools including Adams Elementary School, Mount Logan Middle School, and Logan High School.
Ownership History
Date
Name
Owned For
Owner Type
Purchase Details
Closed on
Oct 22, 2021
Sold by
Demorgan Paul S and Grieve Victoria M
Bought by
Demorgan Paul S and Grieve Victoria M
Current Estimated Value
Home Financials for this Owner
Home Financials are based on the most recent Mortgage that was taken out on this home.
Original Mortgage
$125,900
Outstanding Balance
$114,560
Interest Rate
2.8%
Mortgage Type
New Conventional
Estimated Equity
$381,757
Purchase Details
Closed on
May 11, 2018
Sold by
Demorgan Paul De
Bought by
Morgan Paul S De and Grieve Victoria M
Home Financials for this Owner
Home Financials are based on the most recent Mortgage that was taken out on this home.
Original Mortgage
$126,000
Interest Rate
4.44%
Mortgage Type
New Conventional
Purchase Details
Closed on
May 10, 2018
Sold by
Watson Margo J and Margo J Watson Family Trust
Bought by
Demorgan Paul
Home Financials for this Owner
Home Financials are based on the most recent Mortgage that was taken out on this home.
Original Mortgage
$126,000
Interest Rate
4.44%
Mortgage Type
New Conventional
Purchase Details
Closed on
Aug 23, 2016
Sold by
Watson Margo
Bought by
Watson Margo J and Margo J Watson Family Trust
Purchase Details
Closed on
Jun 20, 2007
Sold by
Nelson Adam
Bought by
Watson Margo
Home Financials for this Owner
Home Financials are based on the most recent Mortgage that was taken out on this home.
Original Mortgage
$119,920
Interest Rate
6.16%
Mortgage Type
New Conventional
Purchase Details
Closed on
Jun 19, 2007
Sold by
Nelson Bruce A
Bought by
Nelson Adam
Home Financials for this Owner
Home Financials are based on the most recent Mortgage that was taken out on this home.
Original Mortgage
$119,920
Interest Rate
6.16%
Mortgage Type
New Conventional
Purchase Details
Closed on
Mar 21, 2006
Sold by
Christensen Reuel and Christensen Heather
Bought by
Nelson Adam and Nelson Bruce A
Home Financials for this Owner
Home Financials are based on the most recent Mortgage that was taken out on this home.
Original Mortgage
$123,375
Interest Rate
6.25%
Mortgage Type
FHA
Create a Home Valuation Report for This Property
The Home Valuation Report is an in-depth analysis detailing your home's value as well as a comparison with similar homes in the area
Home Values in the Area
Average Home Value in this Area
Purchase History
| Date | Buyer | Sale Price | Title Company |
|---|---|---|---|
| Demorgan Paul S | -- | Accommodation | |
| Morgan Paul S De | -- | Pinnacle Title | |
| Demorgan Paul | -- | Pinnacle Title Insurance Ag | |
| Watson Margo J | -- | None Available | |
| Watson Margo | -- | American Secure Title | |
| Nelson Adam | -- | American Secure Title | |
| Nelson Adam | -- | American Secure Title |
Source: Public Records
Mortgage History
| Date | Status | Borrower | Loan Amount |
|---|---|---|---|
| Open | Demorgan Paul S | $125,900 | |
| Closed | Demorgan Paul | $126,000 | |
| Previous Owner | Watson Margo | $119,920 | |
| Previous Owner | Nelson Adam | $123,375 |
Source: Public Records
Tax History
| Year | Tax Paid | Tax Assessment Tax Assessment Total Assessment is a certain percentage of the fair market value that is determined by local assessors to be the total taxable value of land and additions on the property. | Land | Improvement |
|---|---|---|---|---|
| 2025 | $180 | $232,255 | $0 | $0 |
| 2024 | $1,845 | $231,160 | $0 | $0 |
| 2023 | $1,927 | $230,090 | $0 | $0 |
| 2022 | $1,779 | $198,345 | $0 | $0 |
| 2021 | $1,425 | $245,460 | $45,000 | $200,460 |
| 2020 | $1,285 | $199,200 | $45,000 | $154,200 |
| 2019 | $1,343 | $199,200 | $45,000 | $154,200 |
| 2018 | $1,275 | $172,680 | $45,000 | $127,680 |
| 2017 | $1,221 | $87,450 | $0 | $0 |
| 2016 | $1,266 | $83,050 | $0 | $0 |
| 2015 | $1,204 | $83,050 | $0 | $0 |
| 2014 | $1,088 | $83,050 | $0 | $0 |
| 2013 | -- | $79,955 | $0 | $0 |
Source: Public Records
Map
Nearby Homes
Your Personal Tour Guide
Ask me questions while you tour the home.