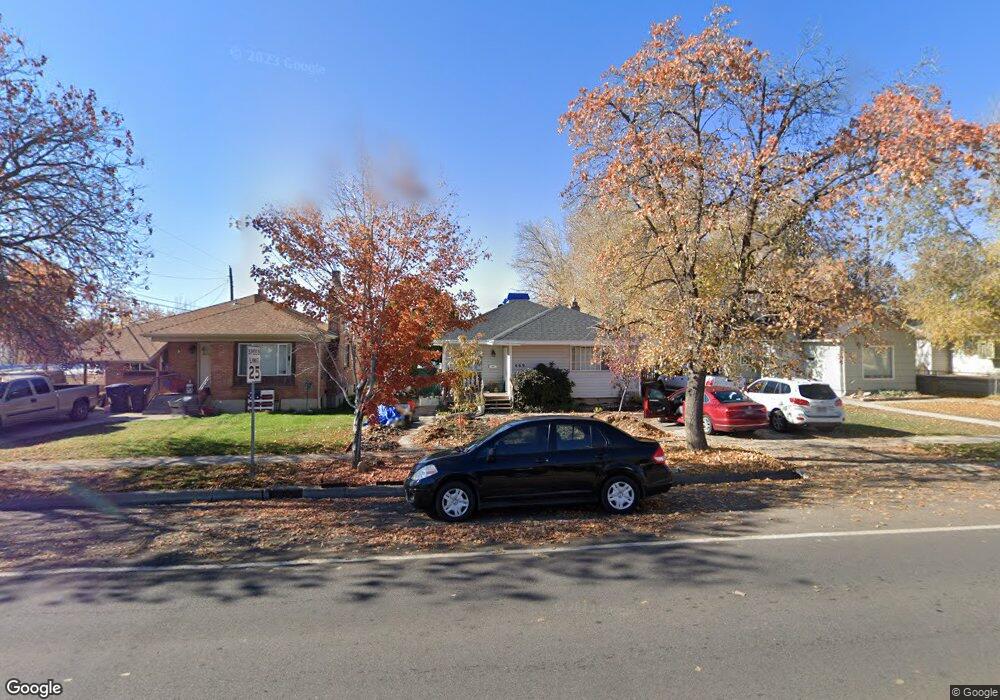
469 N 900 W Provo, UT 84601
Rivergrove NeighborhoodEstimated Value: $426,000 - $478,000
4
Beds
2
Baths
2,280
Sq Ft
$200/Sq Ft
Est. Value
About This Home
This home is located at 469 N 900 W, Provo, UT 84601 and is currently estimated at $455,099, approximately $199 per square foot. 469 N 900 W is a home located in Utah County with nearby schools including Timpanogos Elementary School, Dixon Middle School, and Provo High School.
Ownership History
Date
Name
Owned For
Owner Type
Purchase Details
Closed on
Mar 26, 2018
Sold by
Adair Kaylee and Adair Jarom
Bought by
Adair Jarom and Adair Kaylee
Current Estimated Value
Home Financials for this Owner
Home Financials are based on the most recent Mortgage that was taken out on this home.
Original Mortgage
$99,000
Outstanding Balance
$29,854
Interest Rate
4.38%
Mortgage Type
New Conventional
Estimated Equity
$425,245
Purchase Details
Closed on
Jun 17, 2003
Sold by
Christiansen Richard F and Christiansen Nancy B
Bought by
Adair Kaylee and Adair Jarom
Home Financials for this Owner
Home Financials are based on the most recent Mortgage that was taken out on this home.
Original Mortgage
$138,230
Interest Rate
5.53%
Mortgage Type
FHA
Purchase Details
Closed on
Feb 7, 2003
Sold by
Coomes Zoe K
Bought by
Christiansen Richard F and Christiansen Nancy B
Create a Home Valuation Report for This Property
The Home Valuation Report is an in-depth analysis detailing your home's value as well as a comparison with similar homes in the area
Home Values in the Area
Average Home Value in this Area
Purchase History
| Date | Buyer | Sale Price | Title Company |
|---|---|---|---|
| Adair Jarom | -- | Accommodation | |
| Adair Kaylee | -- | Century Title | |
| Christiansen Richard F | -- | Century Title |
Source: Public Records
Mortgage History
| Date | Status | Borrower | Loan Amount |
|---|---|---|---|
| Open | Adair Jarom | $99,000 | |
| Closed | Adair Kaylee | $138,230 |
Source: Public Records
Tax History Compared to Growth
Tax History
| Year | Tax Paid | Tax Assessment Tax Assessment Total Assessment is a certain percentage of the fair market value that is determined by local assessors to be the total taxable value of land and additions on the property. | Land | Improvement |
|---|---|---|---|---|
| 2025 | $2,142 | $229,295 | $157,000 | $259,900 |
| 2024 | $2,142 | $210,870 | $0 | $0 |
| 2023 | $2,157 | $209,275 | $0 | $0 |
| 2022 | $2,205 | $215,765 | $0 | $0 |
| 2021 | $1,675 | $285,900 | $99,600 | $186,300 |
| 2020 | $1,625 | $259,900 | $90,500 | $169,400 |
| 2019 | $1,552 | $258,300 | $90,500 | $167,800 |
| 2018 | $1,395 | $235,400 | $86,800 | $148,600 |
| 2017 | $1,239 | $114,840 | $0 | $0 |
| 2016 | $1,212 | $104,775 | $0 | $0 |
| 2015 | $1,082 | $94,490 | $0 | $0 |
| 2014 | $985 | $89,650 | $0 | $0 |
Source: Public Records
Map
Nearby Homes