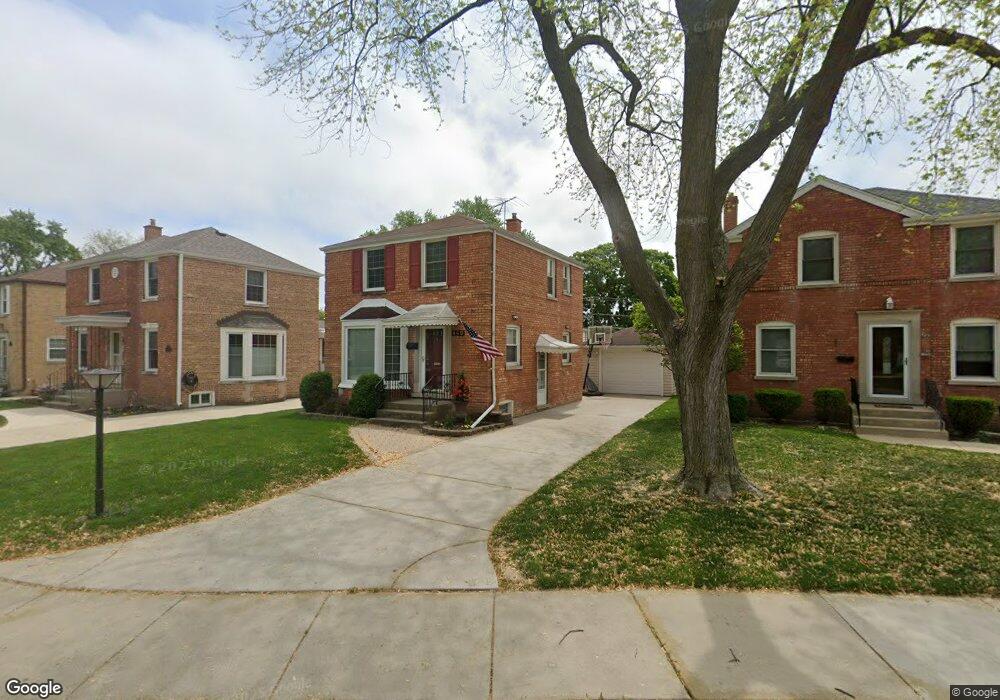
469 Rose Ave Des Plaines, IL 60016
Estimated Value: $375,854 - $408,000
3
Beds
3
Baths
1,352
Sq Ft
$292/Sq Ft
Est. Value
About This Home
This home is located at 469 Rose Ave, Des Plaines, IL 60016 and is currently estimated at $394,714, approximately $291 per square foot. 469 Rose Ave is a home located in Cook County with nearby schools including Terrace Elementary School, Chippewa Middle School, and Maine West High School.
Ownership History
Date
Name
Owned For
Owner Type
Purchase Details
Closed on
Feb 5, 2021
Sold by
Roggi Joseph L and Roggi Dianne M
Bought by
Roggi Joseph L and Roggi Diane M
Current Estimated Value
Home Financials for this Owner
Home Financials are based on the most recent Mortgage that was taken out on this home.
Original Mortgage
$169,000
Outstanding Balance
$150,575
Interest Rate
2.87%
Mortgage Type
New Conventional
Estimated Equity
$244,139
Purchase Details
Closed on
Nov 9, 2001
Sold by
Ohara Brian Patrick and Ohara Joan M
Bought by
Roggi Joseph L
Home Financials for this Owner
Home Financials are based on the most recent Mortgage that was taken out on this home.
Original Mortgage
$180,000
Interest Rate
6.62%
Create a Home Valuation Report for This Property
The Home Valuation Report is an in-depth analysis detailing your home's value as well as a comparison with similar homes in the area
Home Values in the Area
Average Home Value in this Area
Purchase History
| Date | Buyer | Sale Price | Title Company |
|---|---|---|---|
| Roggi Joseph L | -- | Near North Title | |
| Roggi Joseph L | $225,000 | -- |
Source: Public Records
Mortgage History
| Date | Status | Borrower | Loan Amount |
|---|---|---|---|
| Open | Roggi Joseph L | $169,000 | |
| Closed | Roggi Joseph L | $180,000 |
Source: Public Records
Tax History
| Year | Tax Paid | Tax Assessment Tax Assessment Total Assessment is a certain percentage of the fair market value that is determined by local assessors to be the total taxable value of land and additions on the property. | Land | Improvement |
|---|---|---|---|---|
| 2025 | $6,590 | $33,000 | $4,886 | $28,114 |
| 2024 | $6,590 | $28,313 | $4,072 | $24,241 |
| 2023 | $6,405 | $28,313 | $4,072 | $24,241 |
| 2022 | $6,405 | $28,313 | $4,072 | $24,241 |
| 2021 | $5,289 | $20,536 | $3,257 | $17,279 |
| 2020 | $5,975 | $22,875 | $3,257 | $19,618 |
| 2019 | $6,718 | $28,391 | $3,257 | $25,134 |
| 2018 | $5,502 | $21,832 | $2,850 | $18,982 |
| 2017 | $5,422 | $21,832 | $2,850 | $18,982 |
| 2016 | $5,856 | $23,572 | $2,850 | $20,722 |
| 2015 | $5,177 | $19,749 | $2,443 | $17,306 |
| 2014 | $5,084 | $19,749 | $2,443 | $17,306 |
| 2013 | $4,940 | $19,749 | $2,443 | $17,306 |
Source: Public Records
Map
Nearby Homes
- 508 Crestwood Dr
- 652 E Prairie Ave
- 556 Orchard Ct
- 980 W Grant Dr
- 503 La Salle St
- 1122 Alfini Dr
- 681 S Mount Prospect Rd
- 584 S 4th Ave
- 886 E Thacker St
- 373 Woodbridge St
- 887 Ingram Place
- 674 E Algonquin Rd
- 1205 S Wolf Rd
- 105 King Ln
- 1162 W Grant Dr
- 321 Woodbridge St
- 147 Lance Dr
- 890 North Ave
- 170 Westmere Rd
- 1005 Woodlawn Ave
Your Personal Tour Guide
Ask me questions while you tour the home.