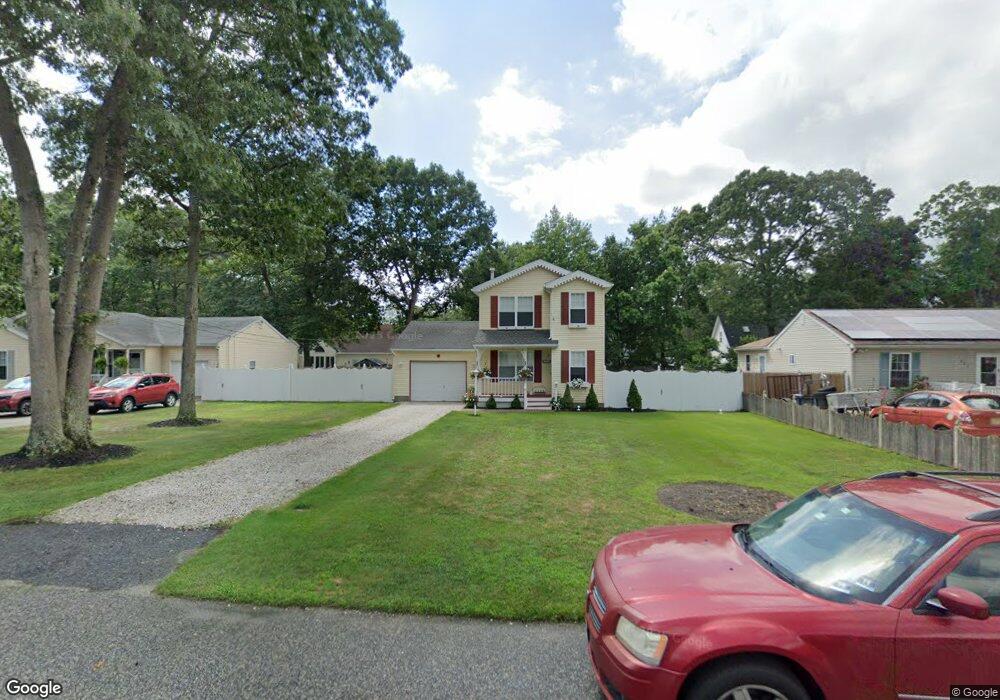
469 S Poplar Ave Galloway, NJ 08205
Estimated Value: $318,964 - $411,000
--
Bed
--
Bath
1,504
Sq Ft
$251/Sq Ft
Est. Value
About This Home
This home is located at 469 S Poplar Ave, Galloway, NJ 08205 and is currently estimated at $376,991, approximately $250 per square foot. 469 S Poplar Ave is a home located in Atlantic County with nearby schools including Oakcrest High School, Cedar Creek High School, and Jersey Shore Baptist Academy.
Ownership History
Date
Name
Owned For
Owner Type
Purchase Details
Closed on
Apr 27, 1998
Sold by
Esposito Richard J and Esposito Florence
Bought by
Esposito Richard J and Esposito Janice H
Current Estimated Value
Home Financials for this Owner
Home Financials are based on the most recent Mortgage that was taken out on this home.
Original Mortgage
$104,500
Outstanding Balance
$19,855
Interest Rate
7.11%
Estimated Equity
$357,136
Purchase Details
Closed on
Apr 23, 1998
Sold by
Walter Michael T
Bought by
Esposito Richard J and Esposito Florence
Home Financials for this Owner
Home Financials are based on the most recent Mortgage that was taken out on this home.
Original Mortgage
$104,500
Outstanding Balance
$19,855
Interest Rate
7.11%
Estimated Equity
$357,136
Purchase Details
Closed on
Mar 10, 1992
Sold by
Gromart Associates
Bought by
Gross Stephen A
Purchase Details
Closed on
Oct 9, 1990
Sold by
Swain Grace
Bought by
Gro-Mart
Purchase Details
Closed on
Sep 14, 1989
Sold by
Swain Grace and Swain Mcdyer,John
Bought by
Swain Grace
Create a Home Valuation Report for This Property
The Home Valuation Report is an in-depth analysis detailing your home's value as well as a comparison with similar homes in the area
Home Values in the Area
Average Home Value in this Area
Purchase History
| Date | Buyer | Sale Price | Title Company |
|---|---|---|---|
| Esposito Richard J | -- | -- | |
| Esposito Richard J | $119,000 | First American Title Ins Co | |
| Gross Stephen A | -- | -- | |
| Gro-Mart | $22,000 | -- | |
| Swain Grace | $7,000 | -- |
Source: Public Records
Mortgage History
| Date | Status | Borrower | Loan Amount |
|---|---|---|---|
| Open | Esposito Richard J | $104,500 |
Source: Public Records
Tax History Compared to Growth
Tax History
| Year | Tax Paid | Tax Assessment Tax Assessment Total Assessment is a certain percentage of the fair market value that is determined by local assessors to be the total taxable value of land and additions on the property. | Land | Improvement |
|---|---|---|---|---|
| 2025 | $5,424 | $162,500 | $45,100 | $117,400 |
| 2024 | $5,424 | $162,500 | $45,100 | $117,400 |
| 2023 | $5,218 | $162,500 | $45,100 | $117,400 |
| 2022 | $5,218 | $162,500 | $45,100 | $117,400 |
| 2021 | $5,114 | $162,500 | $45,100 | $117,400 |
| 2020 | $5,033 | $162,500 | $45,100 | $117,400 |
| 2019 | $4,940 | $162,500 | $45,100 | $117,400 |
| 2018 | $5,010 | $162,500 | $45,100 | $117,400 |
| 2017 | $5,010 | $162,500 | $45,100 | $117,400 |
| 2016 | $4,966 | $162,500 | $45,100 | $117,400 |
| 2015 | $4,943 | $162,500 | $45,100 | $117,400 |
| 2014 | $4,779 | $162,500 | $45,100 | $117,400 |
Source: Public Records
Map
Nearby Homes
- 463 Spruce Ave
- 460 Chris Gaupp Dr
- 446 Chris Gaupp Dr
- 0 S Quince Ave Unit 507629
- 0 S Quince Ave Unit 544997
- 0 S Nectar Ave
- 416 S Nectar Ave
- 412A S Nectar Ave
- 502 S Holly Ave
- 413 Genista Ave
- 416 Genista Ave
- 424 A S Willow Ave
- 45 W White Horse Pike
- 493 S Fir Ave
- 45 White Horse
- 26 Fay's Ct
- B: 569 L:32 White Horse Pike
- 477 Damson Ave
- 108 Buchanan Ave
- 104 W White Horse Pike
- 467 S Poplar Ave
- 471 S Poplar Ave
- 468 S Quince Ave
- 465 S Poplar Ave
- 470 S Quince Ave
- 473 S Poplar Ave
- 466 S Quince Ave
- 468 S Poplar Ave
- 470 S Poplar Ave
- 472 S Quince Ave
- 466 S Poplar Ave
- 464 S Quince Ave
- 472 S Poplar Ave
- 475 S Poplar Ave
- 106 Johnson Ave
- 463 S Poplar Ave
- 464 S Poplar Ave
- 474 S Poplar Ave
- 474 S Quince Ave
- 462 S Quince Ave