Estimated Value: $160,051 - $175,000
3
Beds
3
Baths
978
Sq Ft
$171/Sq Ft
Est. Value
About This Home
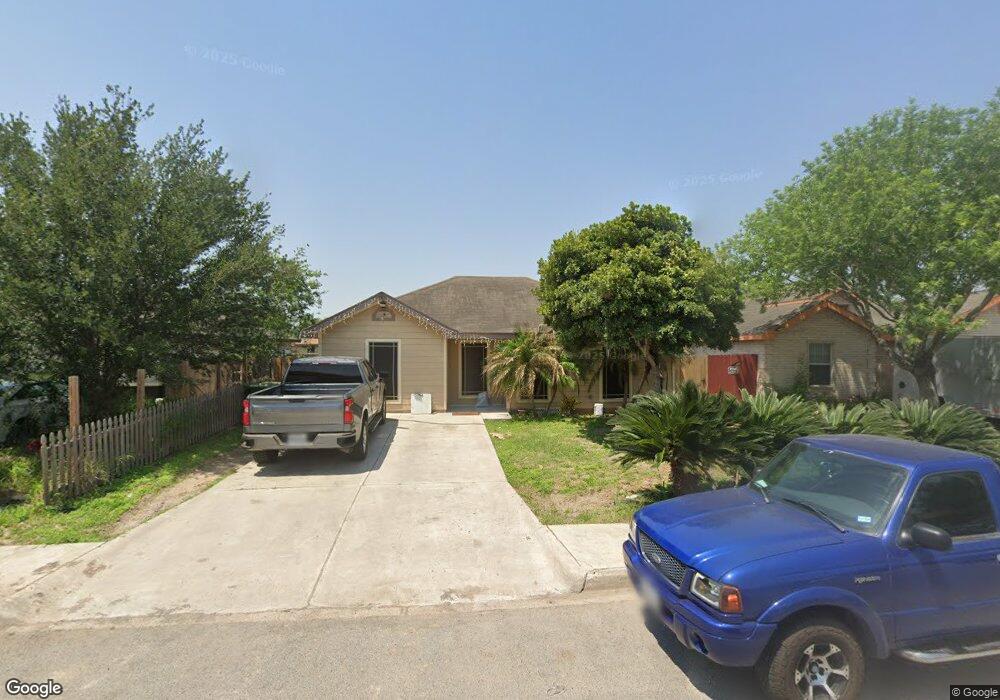
This home is located at 469 Serg Loop, Alamo, TX 78516 and is currently estimated at $167,513, approximately $171 per square foot. 469 Serg Loop is a home located in Hidalgo County with nearby schools including Capt. D. Salinas Elementary School, A.P. Solis Middle School, and Donna High School.
Ownership History
Date
Name
Owned For
Owner Type
Purchase Details
Closed on
Mar 18, 2019
Sold by
El Gato Rentals Llc
Bought by
Gaspar Isaac and Cordero Ana Yuliana
Current Estimated Value
Home Financials for this Owner
Home Financials are based on the most recent Mortgage that was taken out on this home.
Original Mortgage
$96,120
Outstanding Balance
$84,506
Interest Rate
4.4%
Mortgage Type
Purchase Money Mortgage
Estimated Equity
$83,007
Purchase Details
Closed on
Nov 6, 2018
Sold by
Vazquez Librado and Lopez Nereida
Bought by
El Gao Rentals Llc
Purchase Details
Closed on
Aug 23, 2012
Sold by
El Clavo Lumber Lp
Bought by
Vazquez Librado and Lopez Nereida
Home Financials for this Owner
Home Financials are based on the most recent Mortgage that was taken out on this home.
Original Mortgage
$70,200
Interest Rate
3.49%
Mortgage Type
Purchase Money Mortgage
Create a Home Valuation Report for This Property
The Home Valuation Report is an in-depth analysis detailing your home's value as well as a comparison with similar homes in the area
Home Values in the Area
Average Home Value in this Area
Purchase History
| Date | Buyer | Sale Price | Title Company |
|---|---|---|---|
| Gaspar Isaac | -- | Edwards Abstract | |
| El Gao Rentals Llc | $76,239 | None Available | |
| Vazquez Librado | -- | Sierra Title |
Source: Public Records
Mortgage History
| Date | Status | Borrower | Loan Amount |
|---|---|---|---|
| Open | Gaspar Isaac | $96,120 | |
| Previous Owner | Vazquez Librado | $70,200 |
Source: Public Records
Tax History Compared to Growth
Tax History
| Year | Tax Paid | Tax Assessment Tax Assessment Total Assessment is a certain percentage of the fair market value that is determined by local assessors to be the total taxable value of land and additions on the property. | Land | Improvement |
|---|---|---|---|---|
| 2025 | $3,336 | $137,660 | $45,000 | $92,660 |
| 2024 | $3,336 | $128,130 | $40,000 | $88,130 |
| 2023 | $3,286 | $129,090 | $40,000 | $89,090 |
| 2022 | $2,917 | $111,961 | $25,000 | $86,961 |
| 2021 | $2,535 | $96,621 | $25,000 | $71,621 |
| 2020 | $2,328 | $85,869 | $22,813 | $63,056 |
| 2019 | $1,833 | $66,834 | $22,813 | $44,021 |
| 2018 | $1,834 | $67,329 | $22,813 | $44,516 |
| 2017 | $1,729 | $62,693 | $17,188 | $45,505 |
| 2016 | $1,650 | $59,797 | $17,188 | $42,609 |
| 2015 | $1,537 | $60,217 | $17,188 | $43,029 |
Source: Public Records
Map
Nearby Homes