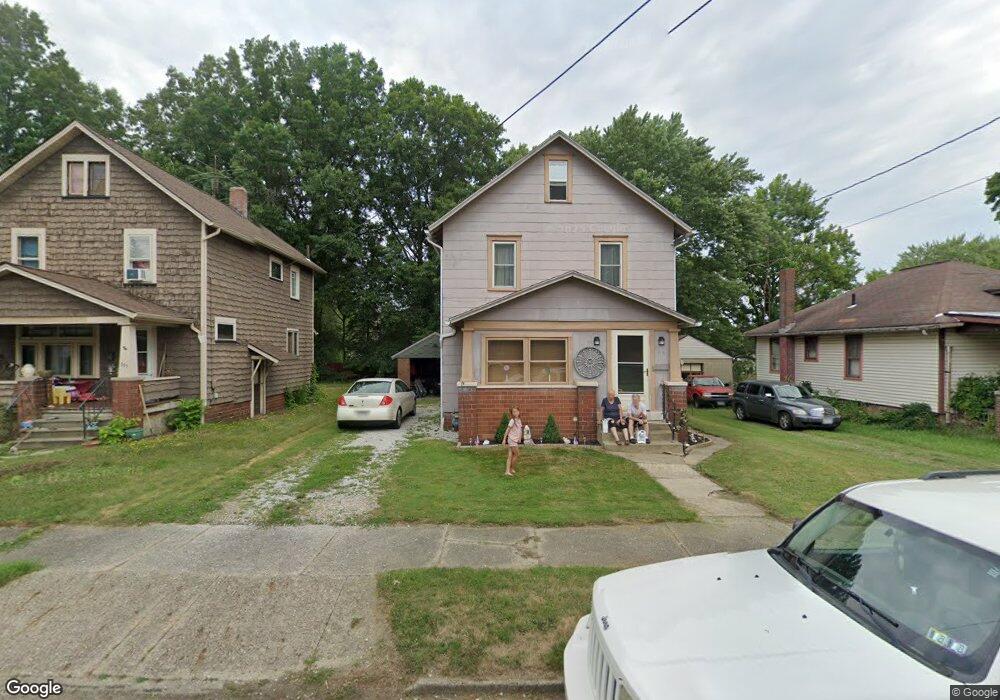
469 W Harrison St Alliance, OH 44601
Estimated Value: $84,788 - $131,000
3
Beds
2
Baths
1,144
Sq Ft
$88/Sq Ft
Est. Value
About This Home
This home is located at 469 W Harrison St, Alliance, OH 44601 and is currently estimated at $100,197, approximately $87 per square foot. 469 W Harrison St is a home located in Stark County with nearby schools including Alliance Early Learning School, Alliance Intermediate School at Northside, and Alliance Middle School.
Ownership History
Date
Name
Owned For
Owner Type
Purchase Details
Closed on
Feb 8, 2024
Sold by
Brown Grace A
Bought by
Brown Grace A and Brown Fred A
Current Estimated Value
Purchase Details
Closed on
Nov 29, 2023
Sold by
Mull Charles and Mull Cheryl A
Bought by
Mull Charles and Mull Charles
Purchase Details
Closed on
May 16, 2002
Sold by
Estate Of Robert Mull
Bought by
Mull Jeanette
Create a Home Valuation Report for This Property
The Home Valuation Report is an in-depth analysis detailing your home's value as well as a comparison with similar homes in the area
Home Values in the Area
Average Home Value in this Area
Purchase History
| Date | Buyer | Sale Price | Title Company |
|---|---|---|---|
| Brown Grace A | -- | None Listed On Document | |
| Mull Charles | -- | None Listed On Document | |
| Mull Jeanette | -- | -- |
Source: Public Records
Tax History Compared to Growth
Tax History
| Year | Tax Paid | Tax Assessment Tax Assessment Total Assessment is a certain percentage of the fair market value that is determined by local assessors to be the total taxable value of land and additions on the property. | Land | Improvement |
|---|---|---|---|---|
| 2025 | -- | $19,540 | $4,450 | $15,090 |
| 2024 | $154 | $19,540 | $4,450 | $15,090 |
| 2023 | $300 | $16,450 | $4,410 | $12,040 |
| 2022 | $312 | $16,450 | $4,410 | $12,040 |
| 2021 | $312 | $16,450 | $4,410 | $12,040 |
| 2020 | $211 | $13,620 | $3,850 | $9,770 |
| 2019 | $208 | $13,620 | $3,850 | $9,770 |
| 2018 | $209 | $13,620 | $3,850 | $9,770 |
| 2017 | $51 | $9,910 | $2,590 | $7,320 |
| 2016 | $448 | $9,910 | $2,590 | $7,320 |
| 2015 | $40 | $9,840 | $2,590 | $7,250 |
| 2014 | $81 | $10,480 | $2,770 | $7,710 |
| 2013 | $40 | $10,480 | $2,770 | $7,710 |
Source: Public Records
Map
Nearby Homes
- 511 W Ely St
- 329 1/2 W Main St
- 345 W Market St
- 163 W Market St
- 132 S Haines Ave
- 432 Johnson Ave
- 000 Meadowbrook Ave
- 710 N Freedom Ave
- 124 E Wayne St
- 0 Meadowbrook Ave
- 000 Klinger Ave
- 427 S Union Ave
- 725 W Summit St
- 734 Parkway Blvd
- 361 E Main St
- 0 Homestead Ave NE
- 140 W Summit St
- 356 E Broadway St
- 0 Johnson Ave NE Unit 5142926
- 807 S Union Ave
- 483 W Harrison St
- 505 W Harrison St
- 490 W Washington St
- 504 W Washington St
- 535 W Harrison St
- 498 W Harrison St
- 457 W Harrison St
- 490 W Harrison St
- 468 W Washington St
- 510 W Harrison St
- 456 W Washington St
- 449 W Harrison St
- 522 W Harrison St
- 545 W Harrison St
- 458 W Harrison St
- 458 W Harrison St
- 441 W Harrison St
- 544 W Harrison St
- 438 W Washington St
- 336 Mckinley Ct