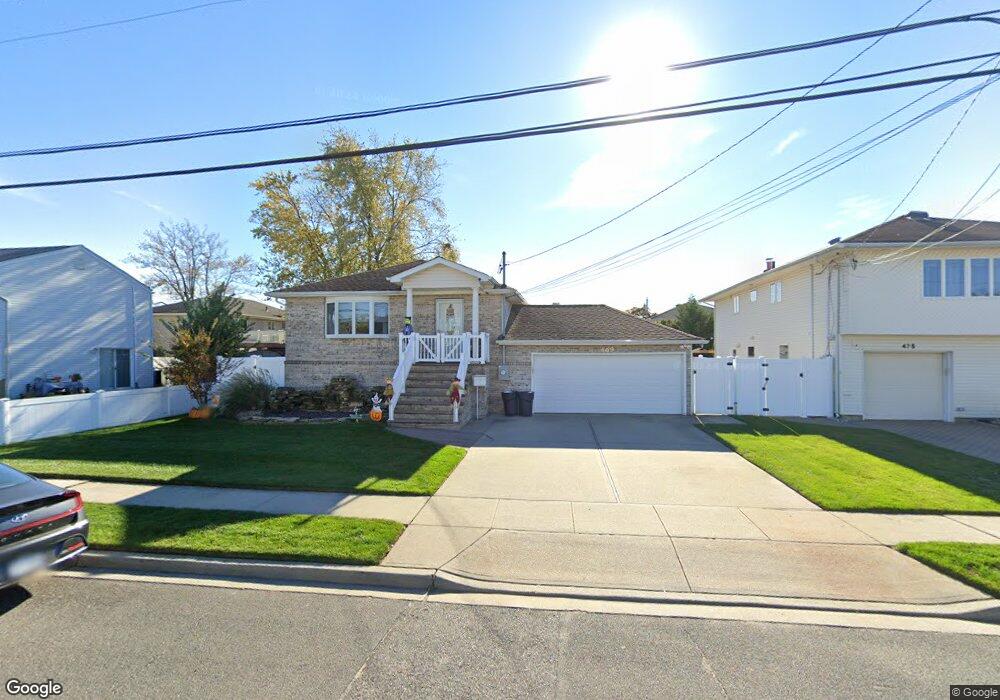
469 Zadig St Oceanside, NY 11572
Estimated Value: $708,000 - $725,122
4
Beds
2
Baths
1,435
Sq Ft
$499/Sq Ft
Est. Value
About This Home
This home is located at 469 Zadig St, Oceanside, NY 11572 and is currently estimated at $716,561, approximately $499 per square foot. 469 Zadig St is a home located in Nassau County with nearby schools including Fulton Avenue Elementary - School 8, Oceanside Middle School, and Oceanside High School.
Ownership History
Date
Name
Owned For
Owner Type
Purchase Details
Closed on
Jan 31, 2020
Sold by
Leggio Jennifer and Leggio Joseph
Bought by
Ali Anishan and Alenci Jolynn
Current Estimated Value
Home Financials for this Owner
Home Financials are based on the most recent Mortgage that was taken out on this home.
Original Mortgage
$484,000
Outstanding Balance
$429,521
Interest Rate
3.72%
Mortgage Type
New Conventional
Estimated Equity
$287,040
Purchase Details
Closed on
Jun 27, 2014
Sold by
Turilli Susan B
Bought by
Leggio Jennifer and Leggio Joseph
Home Financials for this Owner
Home Financials are based on the most recent Mortgage that was taken out on this home.
Original Mortgage
$292,000
Interest Rate
4.12%
Mortgage Type
New Conventional
Purchase Details
Closed on
Sep 22, 2008
Sold by
Turilli Susan B
Bought by
Turilli Susan B and Turilli Vincent J
Create a Home Valuation Report for This Property
The Home Valuation Report is an in-depth analysis detailing your home's value as well as a comparison with similar homes in the area
Home Values in the Area
Average Home Value in this Area
Purchase History
| Date | Buyer | Sale Price | Title Company |
|---|---|---|---|
| Ali Anishan | $510,000 | None Available | |
| Leggio Jennifer | $365,000 | Chicago Title | |
| Turilli Susan B | -- | The Judicial Title Insurance |
Source: Public Records
Mortgage History
| Date | Status | Borrower | Loan Amount |
|---|---|---|---|
| Open | Ali Anishan | $484,000 | |
| Previous Owner | Leggio Jennifer | $292,000 |
Source: Public Records
Tax History Compared to Growth
Tax History
| Year | Tax Paid | Tax Assessment Tax Assessment Total Assessment is a certain percentage of the fair market value that is determined by local assessors to be the total taxable value of land and additions on the property. | Land | Improvement |
|---|---|---|---|---|
| 2025 | $12,509 | $453 | $180 | $273 |
| 2024 | $3,406 | $437 | $174 | $263 |
| 2023 | $11,127 | $459 | $183 | $276 |
| 2022 | $11,127 | $485 | $193 | $292 |
| 2021 | $15,699 | $516 | $206 | $310 |
| 2020 | $12,703 | $691 | $510 | $181 |
| 2019 | $3,711 | $740 | $546 | $194 |
| 2018 | $3,915 | $817 | $0 | $0 |
| 2017 | $7,889 | $808 | $672 | $136 |
| 2016 | $11,586 | $808 | $672 | $136 |
| 2015 | -- | $808 | $672 | $136 |
| 2014 | -- | $808 | $672 | $136 |
| 2013 | $2,937 | $768 | $639 | $129 |
Source: Public Records
Map
Nearby Homes
- 3449 Weidner Ave
- 3434 Elliott Blvd
- 584 Yale St
- 3356 Weidner Ave
- 3354 Murdock Ave
- 3337 Murdock Ave
- 450 Morea St
- 3340 Yost Blvd
- 15 Kirgan Ct
- 4 Rose St Unit 7,C-1
- 4 Rose St Unit 6 -2A
- 380 Evans Ave
- 266 Thompson Ave
- 361 Evans Ave
- 254 Thompson Ave
- 9 James St S
- 129 West Blvd
- 10 8th Ave
- 242 Thompson Ave
- 119 West Blvd
- 475 Zadig St
- 3472 Weidner Ave Unit House
- 3472 Weidner Ave
- 3472 Weidner Ave
- 459 Zadig St
- 474 Bender St
- 470 Bender St
- 470 Bender St
- 481 Zadig St
- 3480 Weidner Ave
- 470 Zadig St
- 476 Zadig St
- 3452 Weidner Ave
- 3473 Margie St
- 491 Zadig St
- 482 Zadig St
- 482 Zadig St Unit 2nd fl
- 3479 Margie St
- 488 Zadig St
- 3444 Weidner Ave