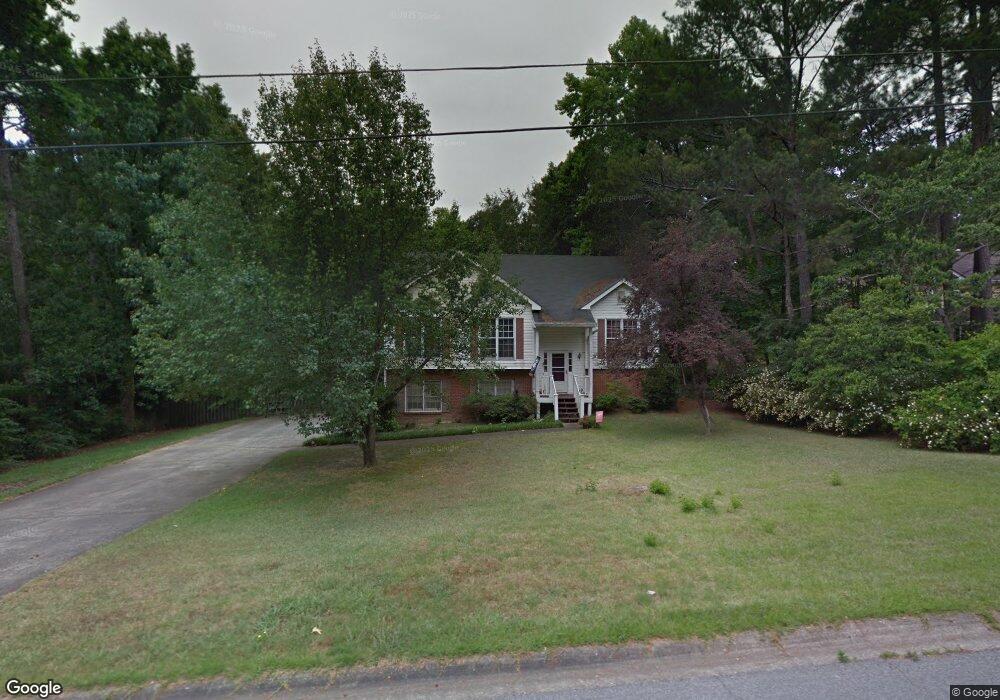
4690 Brandon Acres Ln Buford, GA 30519
Estimated Value: $395,000 - $416,000
3
Beds
2
Baths
1,440
Sq Ft
$280/Sq Ft
Est. Value
About This Home
This home is located at 4690 Brandon Acres Ln, Buford, GA 30519 and is currently estimated at $403,117, approximately $279 per square foot. 4690 Brandon Acres Ln is a home located in Gwinnett County with nearby schools including Duncan Creek Elementary School, Frank N. Osborne Middle School, and Mill Creek High School.
Ownership History
Date
Name
Owned For
Owner Type
Purchase Details
Closed on
Jun 23, 2006
Sold by
Self Preston K
Bought by
Self Preston K and Self Deborah L
Current Estimated Value
Home Financials for this Owner
Home Financials are based on the most recent Mortgage that was taken out on this home.
Original Mortgage
$23,250
Outstanding Balance
$13,581
Interest Rate
6.55%
Mortgage Type
New Conventional
Estimated Equity
$389,536
Purchase Details
Closed on
Jul 29, 1994
Sold by
Dallas Stephen G
Bought by
Wall James W Karen Lyn
Home Financials for this Owner
Home Financials are based on the most recent Mortgage that was taken out on this home.
Original Mortgage
$105,450
Interest Rate
8.53%
Create a Home Valuation Report for This Property
The Home Valuation Report is an in-depth analysis detailing your home's value as well as a comparison with similar homes in the area
Home Values in the Area
Average Home Value in this Area
Purchase History
| Date | Buyer | Sale Price | Title Company |
|---|---|---|---|
| Self Preston K | -- | -- | |
| Wall James W Karen Lyn | $111,000 | -- |
Source: Public Records
Mortgage History
| Date | Status | Borrower | Loan Amount |
|---|---|---|---|
| Open | Self Preston K | $23,250 | |
| Open | Self Preston K | $128,000 | |
| Previous Owner | Wall James W Karen Lyn | $105,450 |
Source: Public Records
Tax History Compared to Growth
Tax History
| Year | Tax Paid | Tax Assessment Tax Assessment Total Assessment is a certain percentage of the fair market value that is determined by local assessors to be the total taxable value of land and additions on the property. | Land | Improvement |
|---|---|---|---|---|
| 2025 | $3,774 | $147,960 | $36,080 | $111,880 |
| 2024 | $3,886 | $146,600 | $30,000 | $116,600 |
| 2023 | $3,886 | $138,680 | $26,000 | $112,680 |
| 2022 | $3,285 | $119,560 | $26,000 | $93,560 |
| 2021 | $2,770 | $92,720 | $20,800 | $71,920 |
| 2020 | $2,655 | $86,440 | $18,720 | $67,720 |
| 2019 | $2,599 | $86,440 | $18,720 | $67,720 |
| 2018 | $2,359 | $75,360 | $15,920 | $59,440 |
| 2016 | $2,108 | $62,720 | $10,800 | $51,920 |
| 2015 | $2,122 | $62,720 | $10,800 | $51,920 |
| 2014 | $1,982 | $55,960 | $10,800 | $45,160 |
Source: Public Records
Map
Nearby Homes
- 4602 Shay Terrace
- 2171 Spring Sound Ln
- 2200 Spring Sound Ln
- 2206 Spring Stone Ct
- 2235 Well Springs Dr
- 4785 Nolans Ridge
- 4457 Water Mill Dr
- 4657 Water Mill Dr NE
- 3475 Duncan Bridge Dr Unit 2
- 4271 Haywater Cove
- 4162 Wyndham Ridge Ct Unit 3
- 4777 Waxwing St
- 2415 Hamilton Parc Ln
- 4645 Spout Springs Rd
- 2485 Hamilton Parc Ln
- 4335 Magpie Dr
- 2424 Pinnae Place
- 4700 Brandon Acres Ln
- 4680 Brandon Acres Ln
- 4710 Brandon Acres Ln
- 2175 Brandon Acres Dr
- 4695 Brandon Acres Ln
- 2165 Brandon Acres Dr
- 2185 Brandon Acres Dr
- 4695 Brandon Acres Ln
- 4650 Brandon Acres Ln
- 4685 Brandon Acres Ln
- 4720 Brandon Acres Ln Unit Ga1356
- 4720 Brandon Acres Ln
- 4720 Brandon Acres Ln Unit GA13565
- 4705 Brandon Acres Ln
- 2155 Brandon Acres Dr
- 4675 Brandon Acres Ln
- 2205 Brandon Acres Dr
- 0 Brandon Acres Dr Unit 8419114
- 0 Brandon Acres Dr Unit 8307337
- 0 Brandon Acres Dr Unit 8276450