4693 N Main St Tulsa, OK 74126
Carriage Trail NeighborhoodEstimated Value: $75,416 - $114,000
3
Beds
1
Bath
1,187
Sq Ft
$78/Sq Ft
Est. Value
About This Home
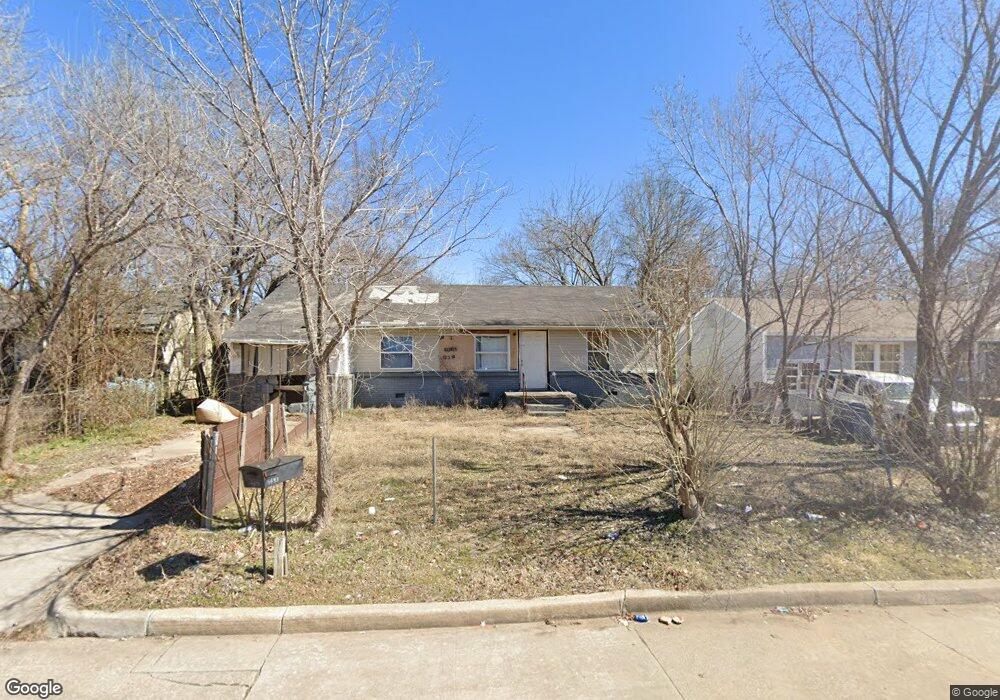
This home is located at 4693 N Main St, Tulsa, OK 74126 and is currently estimated at $92,854, approximately $78 per square foot. 4693 N Main St is a home located in Tulsa County with nearby schools including Monroe Demonstration Academy, McLain High School of Science and Technology, and Tulsa Legacy Charter School.
Ownership History
Date
Name
Owned For
Owner Type
Purchase Details
Closed on
Aug 24, 2023
Sold by
Freedom Ranch Inc
Bought by
Kcby Properties Llc
Current Estimated Value
Purchase Details
Closed on
Oct 30, 2013
Sold by
Calibama Capital Llc
Bought by
Dunn Bob and Dunn Nerrissa
Home Financials for this Owner
Home Financials are based on the most recent Mortgage that was taken out on this home.
Original Mortgage
$20,000
Interest Rate
4.28%
Mortgage Type
New Conventional
Purchase Details
Closed on
Aug 26, 2009
Sold by
Palin Erik S
Bought by
Calibama Capital Llc
Purchase Details
Closed on
Jun 16, 2009
Sold by
Bank Of New York
Bought by
Palin Erik S
Purchase Details
Closed on
Apr 1, 2009
Sold by
Rettig Dennis
Bought by
Bank Of New York
Purchase Details
Closed on
Jun 19, 2007
Sold by
Samco Consulting Inc
Bought by
Rettig Dennis and Rettig Patricia
Home Financials for this Owner
Home Financials are based on the most recent Mortgage that was taken out on this home.
Original Mortgage
$55,250
Interest Rate
6.54%
Mortgage Type
Purchase Money Mortgage
Create a Home Valuation Report for This Property
The Home Valuation Report is an in-depth analysis detailing your home's value as well as a comparison with similar homes in the area
Home Values in the Area
Average Home Value in this Area
Purchase History
| Date | Buyer | Sale Price | Title Company |
|---|---|---|---|
| Kcby Properties Llc | -- | None Listed On Document | |
| Dunn Bob | $20,000 | None Available | |
| Calibama Capital Llc | -- | Oklahoma Reo Closing & Title | |
| Palin Erik S | $7,100 | Oklahoma Reo Closing & Title | |
| Bank Of New York | -- | None Available | |
| Rettig Dennis | $65,000 | Sooner Closing & Title Svcs |
Source: Public Records
Mortgage History
| Date | Status | Borrower | Loan Amount |
|---|---|---|---|
| Previous Owner | Dunn Bob | $20,000 | |
| Previous Owner | Rettig Dennis | $55,250 |
Source: Public Records
Tax History
| Year | Tax Paid | Tax Assessment Tax Assessment Total Assessment is a certain percentage of the fair market value that is determined by local assessors to be the total taxable value of land and additions on the property. | Land | Improvement |
|---|---|---|---|---|
| 2025 | $875 | $6,529 | $607 | $5,922 |
| 2024 | $561 | $6,218 | $693 | $5,525 |
| 2023 | $561 | $4,422 | $542 | $3,880 |
| 2022 | $562 | $4,212 | $594 | $3,618 |
| 2021 | $530 | $4,011 | $650 | $3,361 |
| 2020 | $498 | $3,820 | $619 | $3,201 |
| 2019 | $498 | $3,638 | $589 | $3,049 |
| 2018 | $476 | $3,465 | $561 | $2,904 |
| 2017 | $452 | $3,300 | $693 | $2,607 |
| 2016 | $443 | $3,300 | $693 | $2,607 |
| 2015 | $444 | $3,300 | $693 | $2,607 |
| 2014 | $440 | $3,300 | $693 | $2,607 |
Source: Public Records
Map
Nearby Homes
- 4652 N Main St
- 4697 N Boston Place
- 10 E 50th Place N
- 4624 N Cheyenne Ave
- 4604 N Boston Place
- 0 N Cincinnati Place
- 4710 N Elwood Ave
- 32 E 44th Place N
- 250 E 51st Place N
- 223 E 52nd St N
- 554 E 48th Place N
- 516 E 45th Place N
- 241 E 53rd St N
- 274 E 53rd St N
- 4670 N Hartford Ave
- 543 E 52nd St N
- 414 E 54th St N
- 4303 N Frankfort Place
- 4371 N Garrison Place
- 708 E 46th St N
- 4697 N Main St
- 4689 N Main St
- 4685 N Main St
- 4694 N Boston Ave
- 4690 N Boston Ave
- 4698 N Boston Ave
- 4686 N Boston Ave
- 4694 N Main St
- 4698 N Main St
- 4681 N Main St
- 4690 N Main St
- 5 E 49th St N
- 4680 N Boston Ave
- 4686 N Main St
- 11 E 49th St N
- 1 E 49th St N
- 15 E 49th St N
- 4675 N Main St
- 3 W 49th St N
- 4680 N Main St
Your Personal Tour Guide
Ask me questions while you tour the home.