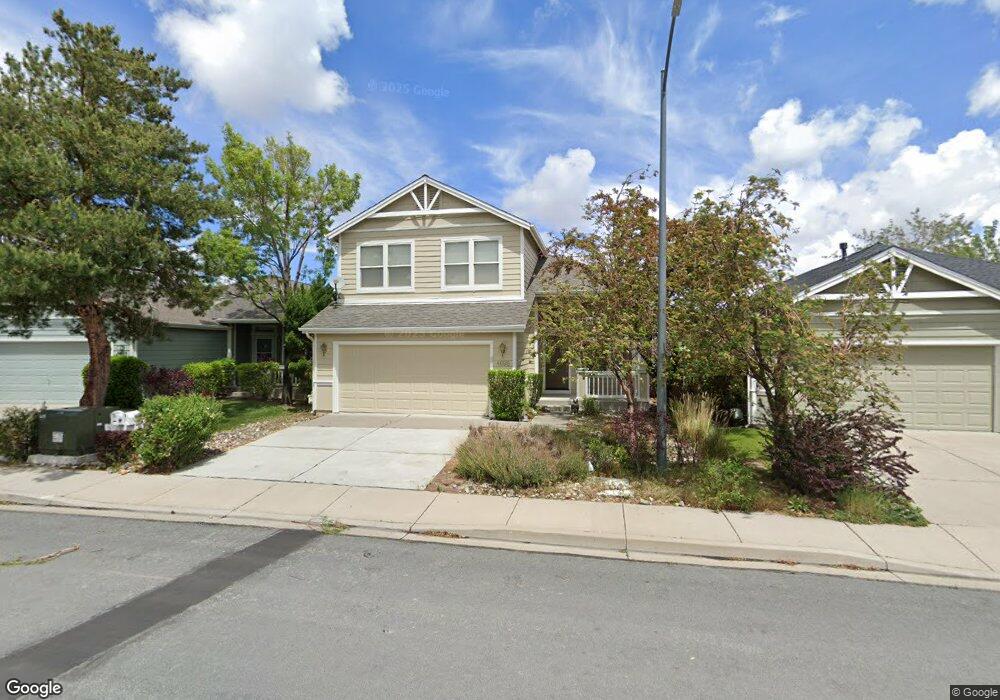
4695 Bradford Ln Reno, NV 89519
South Outer Reno NeighborhoodEstimated Value: $722,978 - $825,000
3
Beds
4
Baths
1,868
Sq Ft
$416/Sq Ft
Est. Value
About This Home
This home is located at 4695 Bradford Ln, Reno, NV 89519 and is currently estimated at $777,245, approximately $416 per square foot. 4695 Bradford Ln is a home located in Washoe County with nearby schools including Caughlin Ranch Elementary School, Darrell C Swope Middle School, and Reno High School.
Ownership History
Date
Name
Owned For
Owner Type
Purchase Details
Closed on
Mar 9, 2021
Sold by
Krogen Gwen E
Bought by
Krogen Gwen K and Krogen Family 2014 Trust
Current Estimated Value
Purchase Details
Closed on
Nov 29, 1995
Sold by
Slocum Sharen L
Bought by
Krogen Roger E and Krogen Gwen E
Home Financials for this Owner
Home Financials are based on the most recent Mortgage that was taken out on this home.
Original Mortgage
$150,000
Outstanding Balance
$3,084
Interest Rate
7.42%
Estimated Equity
$774,161
Purchase Details
Closed on
Nov 27, 1995
Sold by
Krogen Roger E and Krogen Gwen E
Bought by
Krogen Roger E and Krogen Gwen E
Home Financials for this Owner
Home Financials are based on the most recent Mortgage that was taken out on this home.
Original Mortgage
$150,000
Outstanding Balance
$3,084
Interest Rate
7.42%
Estimated Equity
$774,161
Purchase Details
Closed on
Jun 13, 1994
Sold by
Caughlin Crafted Homes
Bought by
Slocum Sharen L
Home Financials for this Owner
Home Financials are based on the most recent Mortgage that was taken out on this home.
Original Mortgage
$151,650
Interest Rate
8.35%
Create a Home Valuation Report for This Property
The Home Valuation Report is an in-depth analysis detailing your home's value as well as a comparison with similar homes in the area
Home Values in the Area
Average Home Value in this Area
Purchase History
| Date | Buyer | Sale Price | Title Company |
|---|---|---|---|
| Krogen Gwen K | -- | None Available | |
| Krogen Gwen E | -- | None Available | |
| Krogen Roger E | $236,000 | First American Title Co | |
| Krogen Roger E | -- | -- | |
| Slocum Sharen L | $190,000 | First American Title |
Source: Public Records
Mortgage History
| Date | Status | Borrower | Loan Amount |
|---|---|---|---|
| Open | Krogen Roger E | $150,000 | |
| Previous Owner | Slocum Sharen L | $151,650 |
Source: Public Records
Tax History Compared to Growth
Tax History
| Year | Tax Paid | Tax Assessment Tax Assessment Total Assessment is a certain percentage of the fair market value that is determined by local assessors to be the total taxable value of land and additions on the property. | Land | Improvement |
|---|---|---|---|---|
| 2025 | $4,275 | $160,551 | $82,152 | $78,399 |
| 2024 | $4,275 | $152,582 | $73,206 | $79,377 |
| 2023 | $3,960 | $152,253 | $76,167 | $76,086 |
| 2022 | $3,667 | $132,841 | $69,615 | $63,226 |
| 2021 | $3,560 | $110,461 | $47,376 | $63,085 |
| 2020 | $3,347 | $112,718 | $48,825 | $63,893 |
| 2019 | $3,188 | $110,819 | $48,573 | $62,246 |
| 2018 | $3,042 | $89,408 | $28,298 | $61,110 |
| 2017 | $2,920 | $87,616 | $26,219 | $61,397 |
| 2016 | $2,846 | $88,961 | $26,219 | $62,742 |
| 2015 | $2,841 | $89,699 | $26,285 | $63,414 |
| 2014 | $2,661 | $81,010 | $19,635 | $61,375 |
| 2013 | -- | $72,928 | $13,440 | $59,488 |
Source: Public Records
Map
Nearby Homes
- 4732 Cedarhill Ln
- 3744 Ranch Crest Dr Unit 1
- 3790 Ranch Crest Dr
- 2790 W Lakeridge Shores
- 3678 Brighton Way
- 1005 Stag Ridge Ct Unit 5
- 4559 Village Green Pkwy
- 4720 Ellicott Way
- 3805 Cashill Blvd
- 3621 Big Bend Ln
- 3475 Meridian Ln
- 5020 Fyvie Ct Unit 4
- 1860 Hunter Creek Rd
- 3381 Cheechako Dr
- 1720 Hunter Creek Rd Unit 5
- 3355 Markridge Dr
- 2240 Silver Ridge Dr
- 2891 Sagittarius Dr
- 0 Meridian Ln Unit 250054401
- 1570 Caughlin Creek Rd
- 4691 Bradford Ln
- 4699 Bradford Ln Unit 2
- 4687 Bradford Ln
- 4703 Bradford Ln
- 4683 Bradford Ln
- 4707 Bradford Ln
- 4688 Bradford Ln
- 4692 Bradford Ln
- 4684 Bradford Ln Unit 1
- 4679 Bradford Ln
- 4711 Bradford Ln
- 4680 Bradford Ln
- 4675 Bradford Ln
- 4715 Bradford Ln
- 4714 Bradford Ln
- 4676 Bradford Ln
- 4724 Cedarhill Ln Unit 2
- 4671 Bradford Ln
- 4695 Hampton Ln
- 4719 Bradford Ln