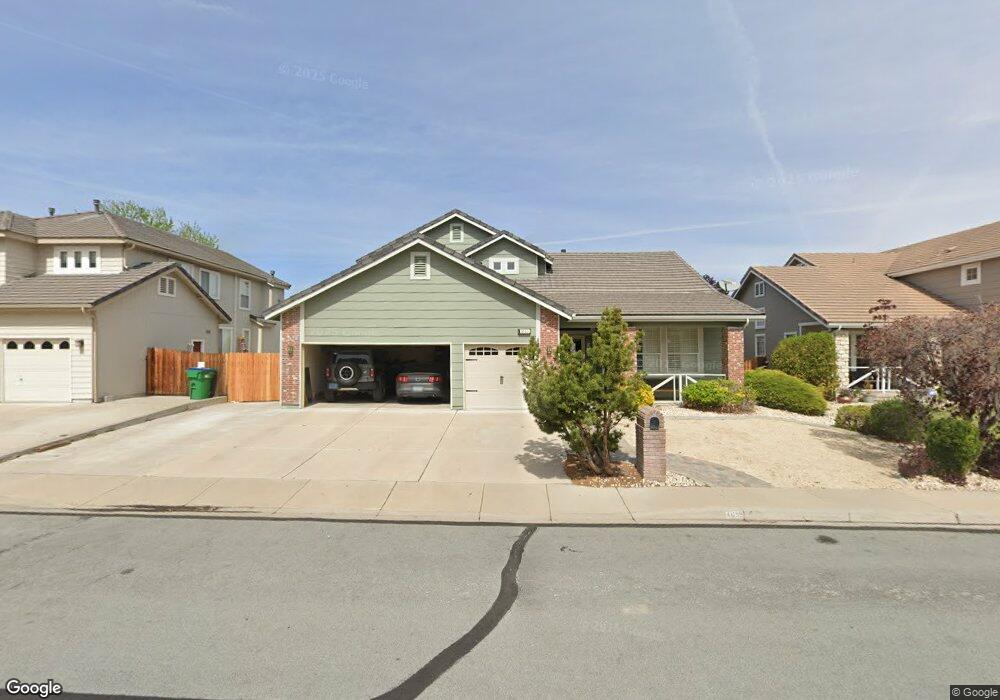
4695 Firtree Ln Sparks, NV 89436
Los Altos Parkway NeighborhoodEstimated Value: $612,000 - $635,000
4
Beds
3
Baths
2,495
Sq Ft
$251/Sq Ft
Est. Value
About This Home
This home is located at 4695 Firtree Ln, Sparks, NV 89436 and is currently estimated at $625,367, approximately $250 per square foot. 4695 Firtree Ln is a home located in Washoe County with nearby schools including Bud Beasley Elementary School, Edward C Reed High School, and Excel Christian School.
Ownership History
Date
Name
Owned For
Owner Type
Purchase Details
Closed on
Apr 23, 2012
Sold by
Watkins Lance C and Watkins Veronica J
Bought by
Watkins Lance C and Watkins Veronica J
Current Estimated Value
Purchase Details
Closed on
May 29, 2002
Sold by
Iwasyszyn Thomas F and Iwasyszyn Mary Ann
Bought by
Watkins Lance C and Watkins Veronica J
Home Financials for this Owner
Home Financials are based on the most recent Mortgage that was taken out on this home.
Original Mortgage
$96,500
Interest Rate
6.89%
Purchase Details
Closed on
Feb 15, 1995
Sold by
Centex Real Estate Corp
Bought by
Iwasyszyn Thomas F and Iwasyszyn Mary Ann
Home Financials for this Owner
Home Financials are based on the most recent Mortgage that was taken out on this home.
Original Mortgage
$145,000
Interest Rate
7.87%
Create a Home Valuation Report for This Property
The Home Valuation Report is an in-depth analysis detailing your home's value as well as a comparison with similar homes in the area
Home Values in the Area
Average Home Value in this Area
Purchase History
| Date | Buyer | Sale Price | Title Company |
|---|---|---|---|
| Watkins Lance C | -- | None Available | |
| Watkins Lance C | $231,500 | Western Title Inc | |
| Iwasyszyn Thomas F | $197,500 | First Centennial Title Co |
Source: Public Records
Mortgage History
| Date | Status | Borrower | Loan Amount |
|---|---|---|---|
| Previous Owner | Watkins Lance C | $96,500 | |
| Previous Owner | Iwasyszyn Thomas F | $145,000 |
Source: Public Records
Tax History Compared to Growth
Tax History
| Year | Tax Paid | Tax Assessment Tax Assessment Total Assessment is a certain percentage of the fair market value that is determined by local assessors to be the total taxable value of land and additions on the property. | Land | Improvement |
|---|---|---|---|---|
| 2025 | $3,270 | $125,281 | $42,560 | $82,721 |
| 2024 | $3,270 | $123,859 | $40,075 | $83,784 |
| 2023 | $3,176 | $118,349 | $38,710 | $79,639 |
| 2022 | $3,082 | $99,486 | $32,830 | $66,656 |
| 2021 | $2,993 | $90,450 | $23,835 | $66,615 |
| 2020 | $2,898 | $90,231 | $23,800 | $66,431 |
| 2019 | $2,813 | $88,057 | $24,360 | $63,697 |
| 2018 | $2,732 | $80,318 | $17,780 | $62,538 |
| 2017 | $2,653 | $79,335 | $16,450 | $62,885 |
| 2016 | $2,585 | $78,768 | $14,525 | $64,243 |
| 2015 | $2,580 | $77,197 | $12,880 | $64,317 |
| 2014 | $2,506 | $72,879 | $10,885 | $61,994 |
| 2013 | -- | $64,238 | $8,925 | $55,313 |
Source: Public Records
Map
Nearby Homes
- 4675 Firtree Ln
- 1550 Istrice Rd
- 4393 Acobat Ct
- 1560 Freeman Way
- 1685 Southview Dr
- 1484 Serendipity Ct
- 1850 Almonte Ct
- 1557 Satellite Dr
- 1475 Golddust Dr
- 4788 Ravello Dr
- 4383 Setting Sun Ct Unit 1
- 1357 Silver View Cir
- 1425 Heaven Dr
- 4515 Whitney Cir
- 1215 Ebling Dr
- 1388 Lambrays Ln
- 1716 Canyon Terrace Dr
- 4748 Pradera St
- 4601 N Cactus Hills Ct
- 5276 Santa Rosa Ave
- 4709 Firtree Ln
- 4685 Firtree Ln
- 4728 Squirreltail Ct
- 4702 Firtree Ln
- 4690 Firtree Ln
- 4725 Firtree Ln
- 4712 Firtree Ln
- 4680 Firtree Ln
- 4665 Firtree Ln
- 4705 Squirreltail Ct
- 4670 Firtree Ln
- 4715 Squirreltail Ct
- 4725 Squirreltail Ct
- 4651 Firtree Ln
- 1570 Squirreltail Dr
- 1580 Squirreltail Dr
- 4660 Firtree Ln
- 1560 Squirreltail Dr
- 4732 Firtree Ln
- 1590 Squirreltail Dr