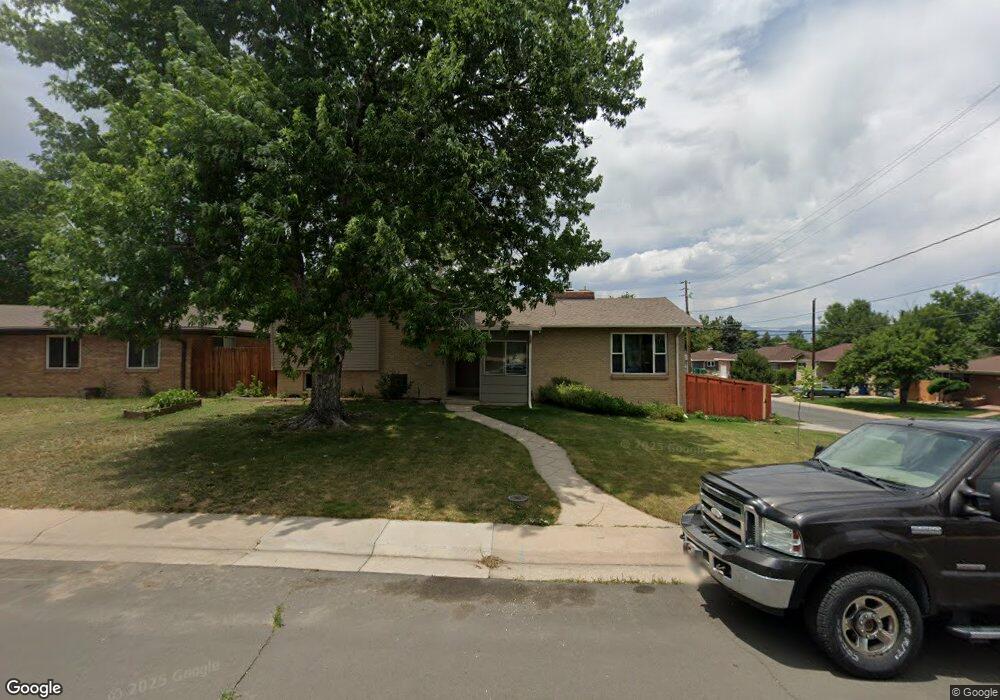
4695 Ingalls St Wheat Ridge, CO 80033
Barths NeighborhoodEstimated Value: $554,000 - $622,000
2
Beds
2
Baths
2,270
Sq Ft
$259/Sq Ft
Est. Value
About This Home
This home is located at 4695 Ingalls St, Wheat Ridge, CO 80033 and is currently estimated at $587,441, approximately $258 per square foot. 4695 Ingalls St is a home located in Jefferson County with nearby schools including Stevens Elementary School, Everitt Middle School, and Wheat Ridge High School.
Ownership History
Date
Name
Owned For
Owner Type
Purchase Details
Closed on
Sep 25, 2014
Sold by
Bearcomesout Cordell T and Bearcomesout Adeline M
Bought by
Britton Jessica
Current Estimated Value
Home Financials for this Owner
Home Financials are based on the most recent Mortgage that was taken out on this home.
Original Mortgage
$195,200
Outstanding Balance
$149,869
Interest Rate
4.14%
Mortgage Type
New Conventional
Estimated Equity
$437,572
Purchase Details
Closed on
May 7, 2010
Sold by
Fannie Mae
Bought by
Bearcomesout Cordell T and Bearcomesout Adeline M
Home Financials for this Owner
Home Financials are based on the most recent Mortgage that was taken out on this home.
Original Mortgage
$164,900
Interest Rate
5.02%
Mortgage Type
New Conventional
Purchase Details
Closed on
Feb 12, 2010
Sold by
Howard Robert G and Howart Ruth E
Bought by
Federal National Mortgage Association
Create a Home Valuation Report for This Property
The Home Valuation Report is an in-depth analysis detailing your home's value as well as a comparison with similar homes in the area
Home Values in the Area
Average Home Value in this Area
Purchase History
| Date | Buyer | Sale Price | Title Company |
|---|---|---|---|
| Britton Jessica | $244,000 | Land Title Guarantee Company | |
| Bearcomesout Cordell T | $170,000 | Assured Title | |
| Federal National Mortgage Association | -- | None Available |
Source: Public Records
Mortgage History
| Date | Status | Borrower | Loan Amount |
|---|---|---|---|
| Open | Britton Jessica | $195,200 | |
| Previous Owner | Bearcomesout Cordell T | $164,900 |
Source: Public Records
Tax History Compared to Growth
Tax History
| Year | Tax Paid | Tax Assessment Tax Assessment Total Assessment is a certain percentage of the fair market value that is determined by local assessors to be the total taxable value of land and additions on the property. | Land | Improvement |
|---|---|---|---|---|
| 2024 | $3,214 | $36,758 | $16,089 | $20,669 |
| 2023 | $3,214 | $36,758 | $16,089 | $20,669 |
| 2022 | $2,794 | $31,382 | $16,211 | $15,171 |
| 2021 | $2,833 | $32,285 | $16,677 | $15,608 |
| 2020 | $2,576 | $29,504 | $15,284 | $14,220 |
| 2019 | $2,541 | $29,504 | $15,284 | $14,220 |
| 2018 | $2,343 | $26,290 | $9,392 | $16,898 |
| 2017 | $2,115 | $26,290 | $9,392 | $16,898 |
| 2016 | $1,947 | $22,638 | $6,280 | $16,358 |
| 2015 | $1,820 | $22,638 | $6,280 | $16,358 |
| 2014 | $1,820 | $19,860 | $5,731 | $14,129 |
Source: Public Records
Map
Nearby Homes
- 4835 Harlan St Unit 14-17
- 6105 W 49th Place
- 4730 Otis St
- 4730 Pierce St
- 4860 Depew St
- 4877 Chase St
- 6920 W 48th Ave Unit 6920
- 6920 W 47th Place
- 4295 Harlan St
- 4155 Ingalls St
- 4541 Reed St
- 5138 W 46th Ave
- 7221 W 48th Ave
- 4460 Sheridan Blvd
- 4320 Benton St
- 7010 W 44th Ave
- 4333 Ames St
- 4185 Benton St
- 5926 W 41st Ave Unit 10
- 4420 Teller St