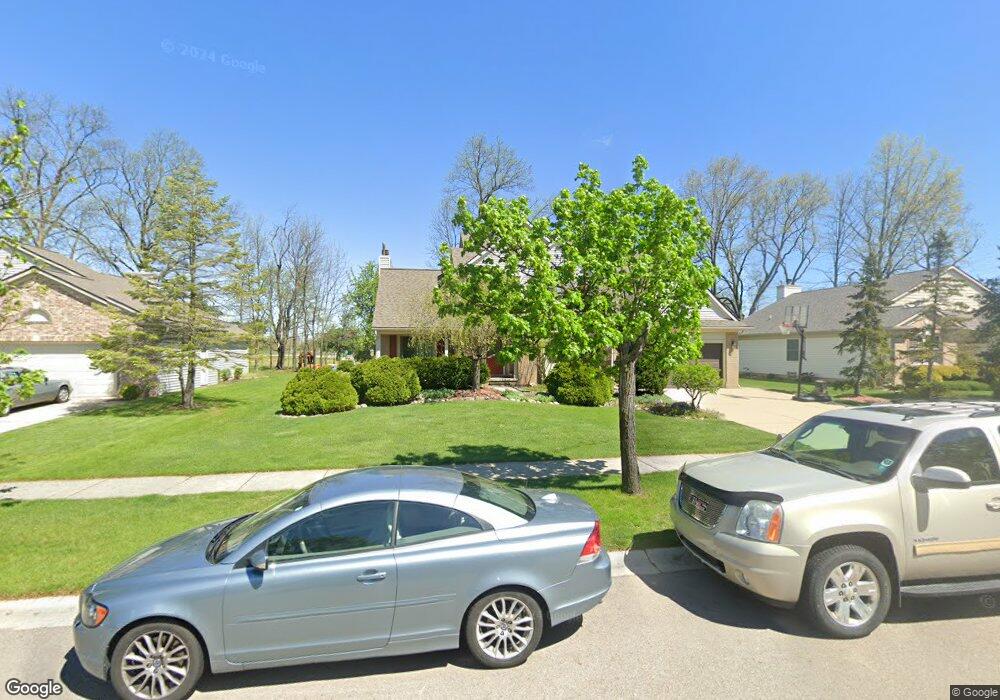
4695 Sycamore Dr Ypsilanti, MI 48197
Estimated Value: $430,476 - $478,000
4
Beds
3
Baths
2,432
Sq Ft
$188/Sq Ft
Est. Value
About This Home
This home is located at 4695 Sycamore Dr, Ypsilanti, MI 48197 and is currently estimated at $458,119, approximately $188 per square foot. 4695 Sycamore Dr is a home located in Washtenaw County with nearby schools including Carpenter Elementary School, Scarlett Middle School, and Huron High School.
Ownership History
Date
Name
Owned For
Owner Type
Purchase Details
Closed on
Oct 15, 2019
Sold by
Keefer Colby and Keefer Sarah
Bought by
Keefer Colby and Keefer Sarah
Current Estimated Value
Purchase Details
Closed on
Nov 13, 2008
Sold by
Vicars Jeffrey and Vicars Jennifer S
Bought by
National City Bank
Purchase Details
Closed on
Nov 11, 2005
Sold by
Vicars Jennifer S
Bought by
Vicars Jeffrey A and Vicars Jennifer S
Home Financials for this Owner
Home Financials are based on the most recent Mortgage that was taken out on this home.
Original Mortgage
$282,400
Interest Rate
8.12%
Mortgage Type
Fannie Mae Freddie Mac
Purchase Details
Closed on
Oct 17, 1997
Sold by
Ashford Village Building
Bought by
Andrea R Martin and Andrea Foley
Home Financials for this Owner
Home Financials are based on the most recent Mortgage that was taken out on this home.
Original Mortgage
$168,500
Interest Rate
7.43%
Mortgage Type
New Conventional
Create a Home Valuation Report for This Property
The Home Valuation Report is an in-depth analysis detailing your home's value as well as a comparison with similar homes in the area
Home Values in the Area
Average Home Value in this Area
Purchase History
| Date | Buyer | Sale Price | Title Company |
|---|---|---|---|
| Keefer Colby | -- | None Available | |
| National City Bank | $291,683 | None Available | |
| Vicars Jeffrey A | -- | Ats | |
| Andrea R Martin | $195,495 | -- |
Source: Public Records
Mortgage History
| Date | Status | Borrower | Loan Amount |
|---|---|---|---|
| Previous Owner | Vicars Jeffrey A | $282,400 | |
| Previous Owner | Andrea R Martin | $168,500 |
Source: Public Records
Tax History Compared to Growth
Tax History
| Year | Tax Paid | Tax Assessment Tax Assessment Total Assessment is a certain percentage of the fair market value that is determined by local assessors to be the total taxable value of land and additions on the property. | Land | Improvement |
|---|---|---|---|---|
| 2025 | $4,795 | $208,949 | $0 | $0 |
| 2024 | $3,207 | $199,688 | $0 | $0 |
| 2023 | $3,082 | $180,600 | $0 | $0 |
| 2022 | $4,678 | $152,400 | $0 | $0 |
| 2021 | $4,571 | $154,000 | $0 | $0 |
| 2020 | $4,468 | $153,100 | $0 | $0 |
| 2019 | $4,210 | $145,000 | $145,000 | $0 |
| 2018 | $4,147 | $132,600 | $0 | $0 |
| 2017 | $4,021 | $129,700 | $0 | $0 |
| 2016 | $2,562 | $100,718 | $0 | $0 |
| 2015 | -- | $100,417 | $0 | $0 |
| 2014 | -- | $97,280 | $0 | $0 |
| 2013 | -- | $97,280 | $0 | $0 |
Source: Public Records
Map
Nearby Homes
- 4835 Willingham Ct
- 4426 Yarmouth Crossing
- 5190 Blue Spruce Dr
- 5776 Staghorn Dr Unit 23
- 5255 Textile Rd
- 5864 Willow Ridge Dr
- 6179 Vail Dr
- 4523 Connor Dr
- 6261 Vail Dr
- 4610 Crane Ct
- Lot 1 Munger Rd
- 4134 Montith Dr
- 2244 Rivendell Ln
- 0 W Michigan Ave Unit 23127022
- 3760 Textile Rd
- 3160 W Michigan Ave
- 4855 W Michigan Ave
- 5831 W Michigan Ave
- 3676 Hayes Ct
- 3655 Hayes Ct
- 4701 Sycamore Dr
- 4709 Sycamore Dr
- 4687 Sycamore Dr
- 4694 Sycamore Dr
- 4692 Sycamore Dr
- 4706 Sycamore Dr
- 4675 Sycamore Dr
- 4713 Sycamore Dr
- 4674 Sycamore Dr
- 5518 Amber Way
- 4659 Sycamore Dr
- 4717 Sycamore Dr
- 5530 Amber Way
- 5544 Amber Way
- 5511 Amber Way
- 4650 Sycamore Dr
- 5552 Amber Way
- 5515 Amber Way
- 4641 Sycamore Dr
- 5560 Amber Way