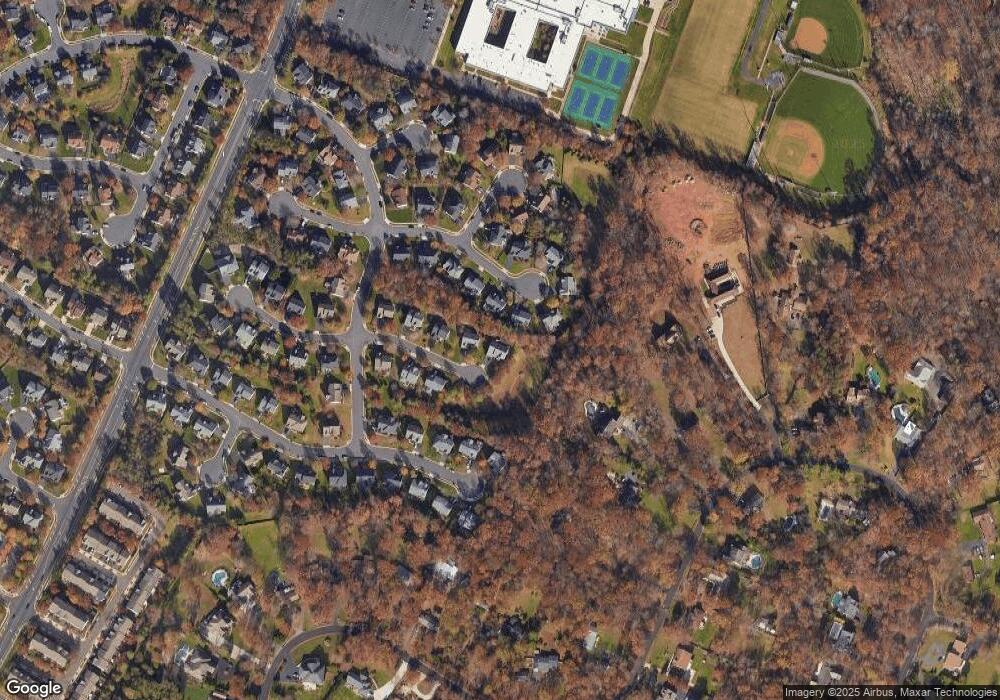
46950 Colby Ct Sterling, VA 20164
Estimated Value: $966,493 - $1,050,000
Studio
4
Baths
3,688
Sq Ft
$269/Sq Ft
Est. Value
About This Home
This home is located at 46950 Colby Ct, Sterling, VA 20164 and is currently estimated at $990,873, approximately $268 per square foot. 46950 Colby Ct is a home located in Loudoun County with nearby schools including Meadowland Elementary School, Seneca Ridge Middle School, and Dominion High School.
Ownership History
Date
Name
Owned For
Owner Type
Purchase Details
Closed on
Jun 11, 2015
Sold by
Chang David C and Chang Ming H
Bought by
Chang David C and Chang Ming H
Current Estimated Value
Home Financials for this Owner
Home Financials are based on the most recent Mortgage that was taken out on this home.
Original Mortgage
$520,000
Outstanding Balance
$404,043
Interest Rate
3.84%
Mortgage Type
New Conventional
Estimated Equity
$586,830
Purchase Details
Closed on
Dec 28, 2005
Sold by
Morse David
Bought by
Chang Ming
Home Financials for this Owner
Home Financials are based on the most recent Mortgage that was taken out on this home.
Original Mortgage
$607,000
Interest Rate
6.39%
Mortgage Type
New Conventional
Purchase Details
Closed on
Dec 18, 1998
Sold by
Centex Homes
Bought by
Morse David B
Home Financials for this Owner
Home Financials are based on the most recent Mortgage that was taken out on this home.
Original Mortgage
$303,120
Interest Rate
6.85%
Create a Home Valuation Report for This Property
The Home Valuation Report is an in-depth analysis detailing your home's value as well as a comparison with similar homes in the area
Home Values in the Area
Average Home Value in this Area
Purchase History
| Date | Buyer | Sale Price | Title Company |
|---|---|---|---|
| Chang David C | -- | -- | |
| Chang Ming | $815,000 | -- | |
| Morse David B | $378,900 | -- |
Source: Public Records
Mortgage History
| Date | Status | Borrower | Loan Amount |
|---|---|---|---|
| Open | Chang David C | $520,000 | |
| Previous Owner | Chang Ming | $607,000 | |
| Previous Owner | Morse David B | $303,120 |
Source: Public Records
Tax History Compared to Growth
Tax History
| Year | Tax Paid | Tax Assessment Tax Assessment Total Assessment is a certain percentage of the fair market value that is determined by local assessors to be the total taxable value of land and additions on the property. | Land | Improvement |
|---|---|---|---|---|
| 2025 | $7,798 | $968,750 | $254,900 | $713,850 |
| 2024 | $7,908 | $914,270 | $254,900 | $659,370 |
| 2023 | $7,324 | $837,040 | $244,900 | $592,140 |
| 2022 | $7,171 | $805,780 | $239,900 | $565,880 |
| 2021 | $6,847 | $698,670 | $209,700 | $488,970 |
| 2020 | $7,009 | $677,160 | $179,700 | $497,460 |
| 2019 | $6,973 | $667,240 | $179,700 | $487,540 |
| 2018 | $7,003 | $645,480 | $179,700 | $465,780 |
| 2017 | $6,984 | $620,830 | $179,700 | $441,130 |
| 2016 | $7,306 | $638,050 | $0 | $0 |
| 2015 | $7,364 | $469,110 | $0 | $469,110 |
| 2014 | -- | $436,510 | $0 | $436,510 |
Source: Public Records
Map
Nearby Homes
- 116 Lake Dr
- 0 Lake Dr
- 47203 Brasswood Place
- 503 E Charlotte St
- 304 Aaron Ct
- 814 Potomac Ridge Ct
- 21799 Leatherleaf Cir
- 21147 Brookside Ln
- 502 Giles Place
- 500 Giles Place
- 1600 N Craig St
- 11908 Plantation Dr Unit A
- 11908 Plantation Dr Unit B
- 21845 Baldwin Square Unit 101
- 100 Marcum Ct
- 307 Brethour Ct
- 309 Brethour Ct
- 46600 Chase View Terrace
- 46893 Eaton Terrace Unit 300
- 304 E Gordon St
- 46946 Colby Ct
- 46945 Buckskin Place
- 46941 Buckskin Place
- 46942 Colby Ct
- 46949 Buckskin Place
- 46937 Buckskin Place
- 46943 Colby Ct
- 46938 Colby Ct
- 46938 Colby Ct Unit BASEMENT
- 46939 Colby Ct
- 46933 Buckskin Place
- 46948 Buckskin Place
- 46910 Antioch Place
- 46906 Antioch Place
- 46914 Antioch Place
- 46902 Antioch Place
- 46944 Buckskin Place
- 46935 Colby Ct
- 21370 Wideoak Ct
- 46929 Buckskin Place
