Estimated Value: $335,914 - $393,000
3
Beds
2
Baths
2,049
Sq Ft
$176/Sq Ft
Est. Value
About This Home
This home is located at 46956 W 251st St S, Depew, OK 74028 and is currently estimated at $359,979, approximately $175 per square foot. 46956 W 251st St S is a home with nearby schools including Depew Elementary School and Depew High School.
Ownership History
Date
Name
Owned For
Owner Type
Purchase Details
Closed on
Sep 24, 2021
Sold by
Norvell Glenn H and Norvell Rencee
Bought by
Parrick Daniel Dean and Parrick Kaila Michelle
Current Estimated Value
Home Financials for this Owner
Home Financials are based on the most recent Mortgage that was taken out on this home.
Original Mortgage
$245,471
Outstanding Balance
$223,847
Interest Rate
2.8%
Mortgage Type
FHA
Estimated Equity
$136,132
Purchase Details
Closed on
Apr 7, 2020
Sold by
Parrick Daniel D and Parrick Kaila M
Bought by
Norvell Glenn H and Norvell Renee
Home Financials for this Owner
Home Financials are based on the most recent Mortgage that was taken out on this home.
Original Mortgage
$184,300
Interest Rate
3.4%
Mortgage Type
New Conventional
Purchase Details
Closed on
Feb 1, 2010
Sold by
Parrick Frankie D and Parrick Bobbie R
Bought by
Parrick Daniel D and Parrick Kaila M
Create a Home Valuation Report for This Property
The Home Valuation Report is an in-depth analysis detailing your home's value as well as a comparison with similar homes in the area
Home Values in the Area
Average Home Value in this Area
Purchase History
| Date | Buyer | Sale Price | Title Company |
|---|---|---|---|
| Parrick Daniel Dean | $250,000 | Integrity Ttl & Closing Llc | |
| Norvell Glenn H | $194,000 | None Available | |
| Parrick Daniel D | $2,500 | -- |
Source: Public Records
Mortgage History
| Date | Status | Borrower | Loan Amount |
|---|---|---|---|
| Open | Parrick Daniel Dean | $245,471 | |
| Previous Owner | Norvell Glenn H | $184,300 |
Source: Public Records
Tax History Compared to Growth
Tax History
| Year | Tax Paid | Tax Assessment Tax Assessment Total Assessment is a certain percentage of the fair market value that is determined by local assessors to be the total taxable value of land and additions on the property. | Land | Improvement |
|---|---|---|---|---|
| 2024 | $2,797 | $32,328 | $1,644 | $30,684 |
| 2023 | $2,797 | $30,789 | $1,644 | $29,145 |
| 2022 | $2,572 | $29,323 | $1,644 | $27,679 |
| 2021 | $1,987 | $23,239 | $1,644 | $21,595 |
| 2020 | $2,016 | $22,972 | $1,644 | $21,328 |
| 2019 | $175 | $1,972 | $1,644 | $328 |
| 2018 | $182 | $2,076 | $1,644 | $432 |
| 2017 | $176 | $2,076 | $1,644 | $432 |
| 2016 | $170 | $2,076 | $1,644 | $432 |
| 2015 | -- | $2,076 | $1,644 | $432 |
| 2014 | -- | $2,076 | $1,644 | $432 |
Source: Public Records
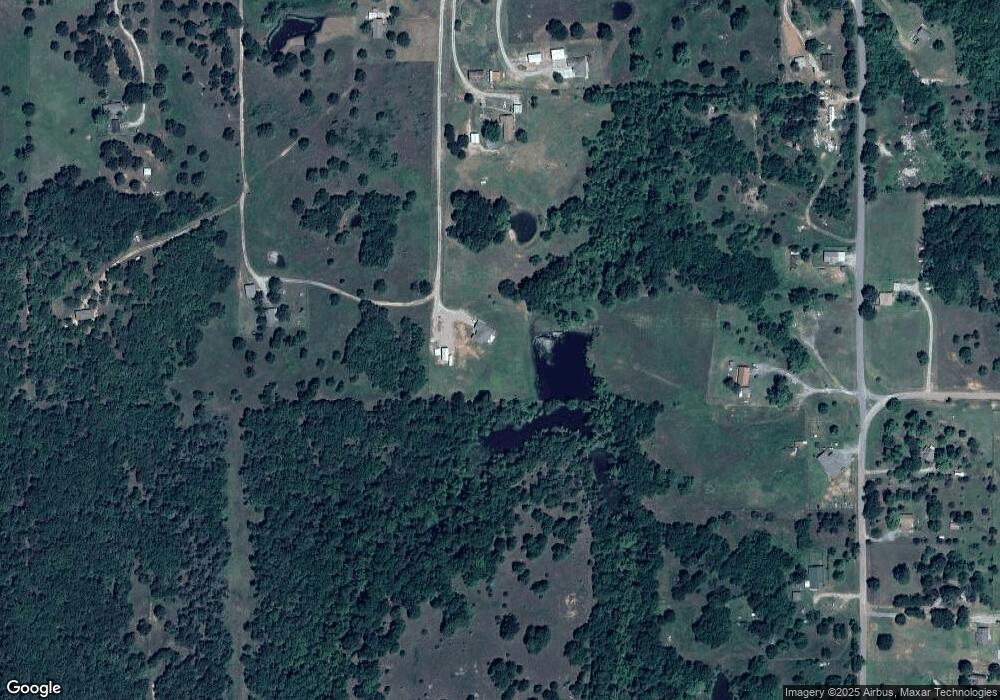
Map
Nearby Homes
- 25831 S 465th West Ave
- 43997 W 251st St S
- 24277 S 497th West Ave
- 27852 S 449th West Ave
- 20AC S 513th Ave W
- 27825 S 449th Ave W
- 27333 S 433rd West Ave
- S S 513th Ave W
- 0000 S 465th West Ave
- 0000 S 465th W Ave
- 0 Milfay Rd Unit 24305302
- 21429 S 465th West Ave
- 42167 W 281st St S
- 21061 S 481st West Ave
- 0 S 529th West Ave
- 21576 Milfay Rd
- 0 W 301st St Unit 1170072
- 19795 S 465th Ave W
- 19795 S 465th West Ave
- 000 W 311th St S
- 46886 W 251st St S
- 25334 S 465th West Ave
- 46984 W 251st St S
- 46734 W 251st St S
- 25460 S 465th West Ave
- 46556 W 251st St S
- 25395 S 465th West Ave
- 25429 S 465th West Ave
- 47196 W 251st St S
- 25467 S 465th West Ave
- 46621 W 251st St S
- 700 W 9th Ave
- 46498 W 251st St S
- 25529 S 465th West Ave
- 25491 S 465th West Ave
- 25634 S 465th West Ave
- 25589 S 465th West Ave
- 721 7th St
- 700 9th St
- 712 Ladd Ave