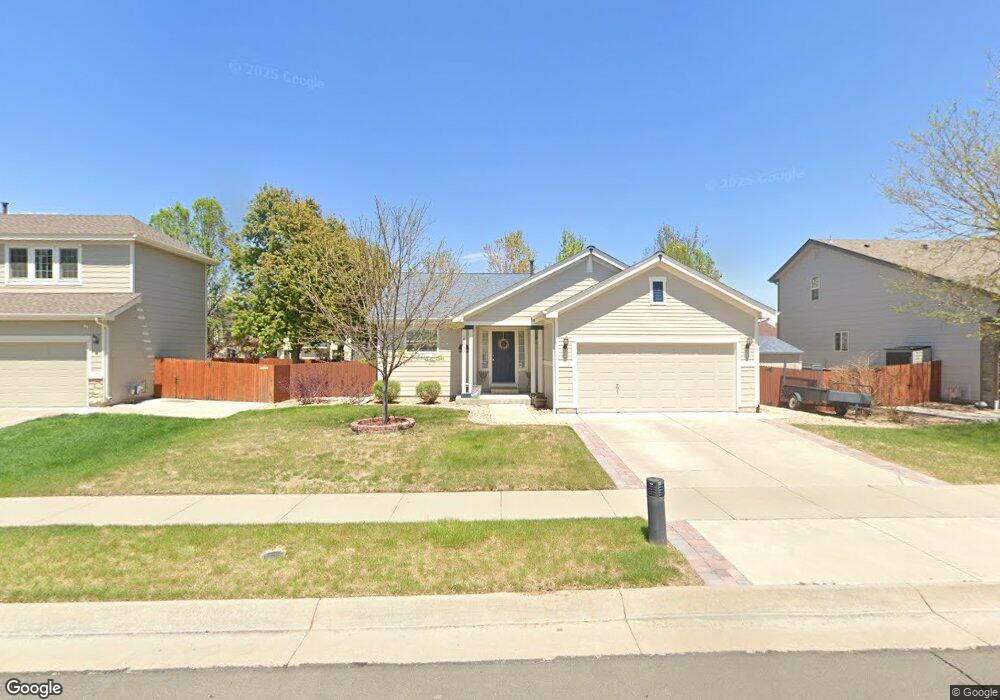
4697 Mt. Princeton St Brighton, CO 80601
Estimated Value: $466,869 - $502,000
3
Beds
2
Baths
1,456
Sq Ft
$333/Sq Ft
Est. Value
About This Home
This home is located at 4697 Mt. Princeton St, Brighton, CO 80601 and is currently estimated at $484,717, approximately $332 per square foot. 4697 Mt. Princeton St is a home located in Adams County with nearby schools including Pennock Elementary School, Overland Trail Middle School, and Brighton High School.
Ownership History
Date
Name
Owned For
Owner Type
Purchase Details
Closed on
Mar 21, 2016
Sold by
Etter Michael and Etter Iya
Bought by
Panda Trust
Current Estimated Value
Purchase Details
Closed on
Nov 18, 2013
Sold by
Hytrek Michael Ryan
Bought by
Etter Michael and Etter Iya
Home Financials for this Owner
Home Financials are based on the most recent Mortgage that was taken out on this home.
Original Mortgage
$173,600
Interest Rate
4.29%
Mortgage Type
New Conventional
Purchase Details
Closed on
Feb 3, 2009
Sold by
Nationstar Mortgage Llc
Bought by
Hytrek Michael Ryan
Home Financials for this Owner
Home Financials are based on the most recent Mortgage that was taken out on this home.
Original Mortgage
$160,047
Interest Rate
4.92%
Mortgage Type
Seller Take Back
Purchase Details
Closed on
Jan 28, 2005
Sold by
Centex Homes
Bought by
Plzola Everardo
Create a Home Valuation Report for This Property
The Home Valuation Report is an in-depth analysis detailing your home's value as well as a comparison with similar homes in the area
Home Values in the Area
Average Home Value in this Area
Purchase History
| Date | Buyer | Sale Price | Title Company |
|---|---|---|---|
| Panda Trust | -- | None Available | |
| Etter Michael | $217,000 | Land Title Guarantee Company | |
| Hytrek Michael Ryan | $163,000 | None Available | |
| Plzola Everardo | $201,193 | Commerce Title |
Source: Public Records
Mortgage History
| Date | Status | Borrower | Loan Amount |
|---|---|---|---|
| Previous Owner | Etter Michael | $173,600 | |
| Previous Owner | Hytrek Michael Ryan | $160,047 |
Source: Public Records
Tax History Compared to Growth
Tax History
| Year | Tax Paid | Tax Assessment Tax Assessment Total Assessment is a certain percentage of the fair market value that is determined by local assessors to be the total taxable value of land and additions on the property. | Land | Improvement |
|---|---|---|---|---|
| 2024 | $4,015 | $29,560 | $6,560 | $23,000 |
| 2023 | $5,153 | $33,960 | $6,360 | $27,600 |
| 2022 | $4,232 | $24,430 | $6,530 | $17,900 |
| 2021 | $4,079 | $24,430 | $6,530 | $17,900 |
| 2020 | $3,949 | $24,600 | $6,720 | $17,880 |
| 2019 | $3,955 | $24,600 | $6,720 | $17,880 |
| 2018 | $3,516 | $21,830 | $3,460 | $18,370 |
| 2017 | $3,519 | $21,830 | $3,460 | $18,370 |
| 2016 | $2,763 | $17,710 | $3,820 | $13,890 |
| 2015 | $2,751 | $17,710 | $3,820 | $13,890 |
| 2014 | -- | $15,520 | $3,260 | $12,260 |
Source: Public Records
Map
Nearby Homes
- 4749 Mount Shavano St
- 4824 Mt Shavano St
- 4950 Mount Cameron Dr
- 4454 Mount Lincoln St
- 4670 Quandary Peak St
- 4314 Mount Oxford St
- 4641 Quandary Peak St
- 4589 Quandary Peak St
- 4445 Tanner Peak Trail
- 376 Lake Granby Ave
- 5113 Grey Swallow St
- 5010 Golden Eagle Pkwy
- 336 Lake Granby Ave
- 316 Lake Granby Ave
- 4591 Crestone Peak St
- 306 Lake Granby Ave
- 19 S 45th Ave
- 5055 Pelican St
- 5174 Golden Eagle Pkwy
- 5157 Goshawk St
- 4697 Mount Princeton St
- 4719 Mt. Princeton St
- 4687 Mt. Princeton St
- 4690 Mount Evans St
- 4729 Mt. Princeton St
- 4696 Mt. Princeton St
- 4680 Mt Evans St
- 4729 Mount Princeton St
- 4718 Mt. Princeton St
- 4690 Mt. Evans St
- 4667 Mt Princeton St
- 4712 Mt. Evans St
- 4686 Mt. Princeton St
- 4667 Mt. Princeton St
- 4680 Mt. Evans St
- 4718 Mount Princeton St
- 4728 Mt. Princeton St
- 4686 Mount Princeton St
- 4722 Mt Evans St
- 4660 Mount Evans St