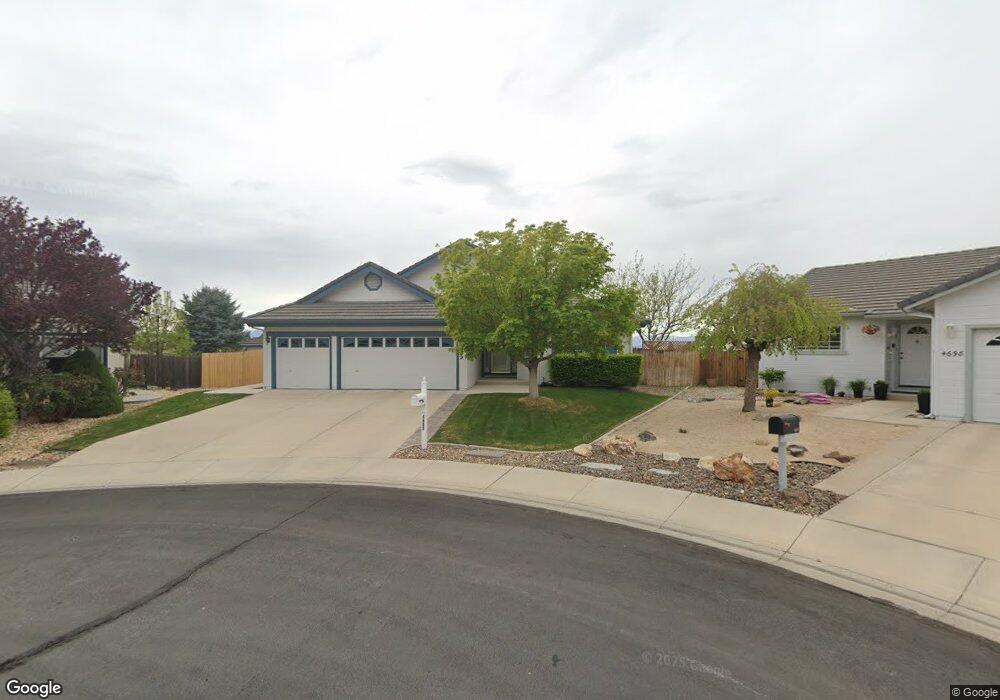
4699 Goodwin Ct Sparks, NV 89436
Los Altos Parkway NeighborhoodEstimated Value: $556,000 - $644,000
3
Beds
2
Baths
1,744
Sq Ft
$341/Sq Ft
Est. Value
About This Home
This home is located at 4699 Goodwin Ct, Sparks, NV 89436 and is currently estimated at $594,674, approximately $340 per square foot. 4699 Goodwin Ct is a home located in Washoe County with nearby schools including Bud Beasley Elementary School, Lou Mendive Middle School, and Edward C Reed High School.
Ownership History
Date
Name
Owned For
Owner Type
Purchase Details
Closed on
Jul 12, 2021
Sold by
Briggs Thomas Arthur and Briggs Linda Sue
Bought by
Briggs Thomas Arthur and Briggs Linda Sue
Current Estimated Value
Home Financials for this Owner
Home Financials are based on the most recent Mortgage that was taken out on this home.
Original Mortgage
$238,000
Outstanding Balance
$215,948
Interest Rate
2.9%
Mortgage Type
New Conventional
Estimated Equity
$378,726
Purchase Details
Closed on
Dec 11, 2013
Sold by
Briggs Thomas A and Briggs Linda S
Bought by
Briggs Thomas Arthur and Briggs Linda Sue
Purchase Details
Closed on
Sep 13, 2000
Sold by
Barker Homes Inc
Bought by
Briggs Thomas A and Briggs Linda S
Home Financials for this Owner
Home Financials are based on the most recent Mortgage that was taken out on this home.
Original Mortgage
$180,800
Interest Rate
8.11%
Create a Home Valuation Report for This Property
The Home Valuation Report is an in-depth analysis detailing your home's value as well as a comparison with similar homes in the area
Home Values in the Area
Average Home Value in this Area
Purchase History
| Date | Buyer | Sale Price | Title Company |
|---|---|---|---|
| Briggs Thomas Arthur | -- | First Centennial Reno | |
| Briggs Thomas Arthur | -- | First Centennial Reno | |
| Briggs Thomas Arthur | -- | None Available | |
| Briggs Thomas A | $229,500 | Stewart Title Northern Nevad |
Source: Public Records
Mortgage History
| Date | Status | Borrower | Loan Amount |
|---|---|---|---|
| Open | Briggs Thomas Arthur | $238,000 | |
| Closed | Briggs Thomas A | $180,800 |
Source: Public Records
Tax History Compared to Growth
Tax History
| Year | Tax Paid | Tax Assessment Tax Assessment Total Assessment is a certain percentage of the fair market value that is determined by local assessors to be the total taxable value of land and additions on the property. | Land | Improvement |
|---|---|---|---|---|
| 2025 | $2,688 | $136,667 | $57,456 | $79,211 |
| 2024 | $2,688 | $136,030 | $56,105 | $79,925 |
| 2023 | $2,612 | $131,816 | $56,130 | $75,687 |
| 2022 | $2,542 | $110,745 | $47,604 | $63,141 |
| 2021 | $2,470 | $86,711 | $23,835 | $62,876 |
| 2020 | $2,396 | $86,851 | $23,800 | $63,051 |
| 2019 | $2,326 | $84,052 | $24,360 | $59,692 |
| 2018 | $2,259 | $76,269 | $17,780 | $58,489 |
| 2017 | $2,193 | $75,100 | $16,450 | $58,650 |
| 2016 | $2,136 | $74,343 | $14,525 | $59,818 |
| 2015 | $1,071 | $72,466 | $12,880 | $59,586 |
| 2014 | $2,073 | $68,319 | $10,885 | $57,434 |
| 2013 | -- | $55,804 | $8,925 | $46,879 |
Source: Public Records
Map
Nearby Homes
- 4601 N Cactus Hills Ct
- 4383 Setting Sun Ct Unit 1
- 1850 Almonte Ct
- 1685 Southview Dr
- 2738 Kettle Ct
- 4675 Firtree Ln
- 4393 Acobat Ct
- 1550 Istrice Rd
- 4677 High Pass Ct
- 1560 Freeman Way
- 2411 Tecumseh Way Unit 12
- 2415 Tecumseh Way
- 4797 High Pass Dr
- 2427 Tecumseh Way Unit 8
- 1716 Canyon Terrace Dr
- 5436 Vista Terrace Ln Unit 2B
- 1484 Serendipity Ct
- 2946 Earthstone Dr
- 3027 Earthstone Dr
- 3028 Earthstone Dr
- 4698 Goodwin Ct
- 4695 Goodwin Ct
- 4696 Goodwin Ct
- 4691 Goodwin Ct
- 4694 Goodwin Ct
- 4689 Goodwin Ct
- 4679 Goodwin Rd
- 4671 Goodwin Rd
- 4692 Goodwin Ct
- 4706 Vista Mountain Ct
- 4708 Vista Mountain Ct
- 4685 Goodwin Ct
- 4690 Goodwin Ct
- 4655 Goodwin Rd
- 4688 Goodwin Ct
- 4649 Goodwin Rd
- 4740 Vista Mountain Dr
- 4730 Vista Mountain Dr
- 4705 Goodwin Rd
- 4720 Vista Mountain Dr