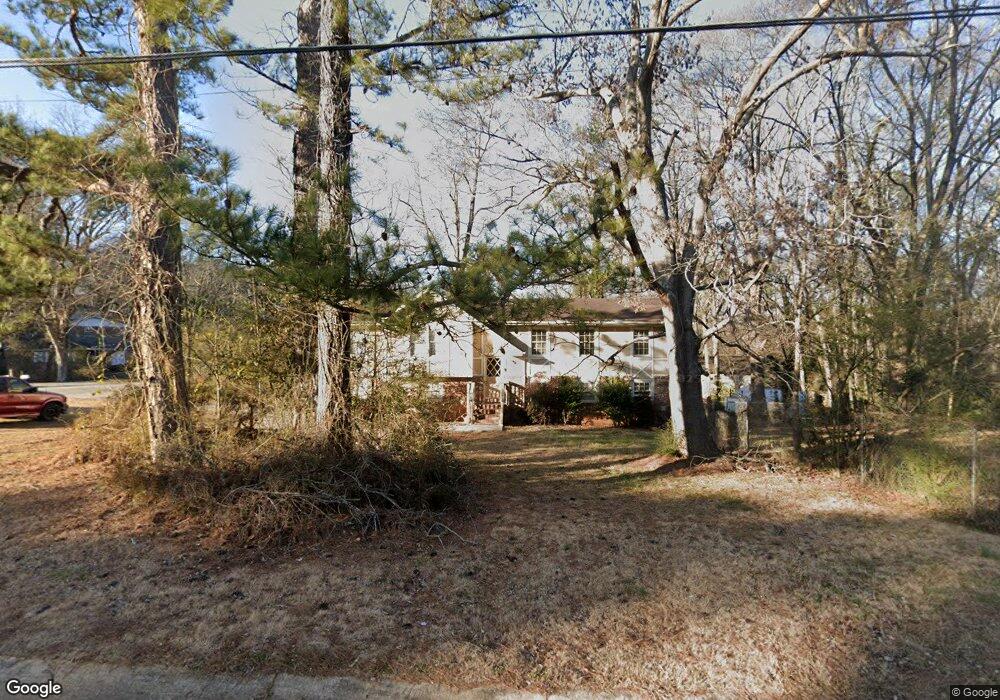
4699 Huntsman Bend Decatur, GA 30034
Southwest DeKalb NeighborhoodEstimated Value: $239,310 - $322,000
5
Beds
2
Baths
1,540
Sq Ft
$178/Sq Ft
Est. Value
About This Home
This home is located at 4699 Huntsman Bend, Decatur, GA 30034 and is currently estimated at $274,578, approximately $178 per square foot. 4699 Huntsman Bend is a home located in DeKalb County with nearby schools including Browns Mill Elementary School, Salem Middle School, and Martin Luther King- Jr. High School.
Ownership History
Date
Name
Owned For
Owner Type
Purchase Details
Closed on
Jul 12, 2018
Sold by
3534 Boring Rd Llc
Bought by
Raffles Cv Llc
Current Estimated Value
Purchase Details
Closed on
Mar 1, 2010
Sold by
Jutan Seth
Bought by
4699 Huntsman Bend Llc
Purchase Details
Closed on
Oct 15, 2009
Sold by
Federal Natl Mtg Assn Fnma
Bought by
Jutan Seth
Purchase Details
Closed on
Aug 4, 2009
Sold by
Wells Fargo Bk Na
Bought by
Federal Natl Mtg Assn Fnma
Purchase Details
Closed on
Nov 30, 2001
Sold by
Lddm Llc
Bought by
Osborne Henry C
Home Financials for this Owner
Home Financials are based on the most recent Mortgage that was taken out on this home.
Original Mortgage
$120,650
Interest Rate
6.6%
Mortgage Type
New Conventional
Purchase Details
Closed on
Aug 7, 2001
Sold by
Warren Wilena A
Bought by
Lddm Llc
Purchase Details
Closed on
Jun 9, 1995
Sold by
Walton Riley
Bought by
Warren Wilena A
Create a Home Valuation Report for This Property
The Home Valuation Report is an in-depth analysis detailing your home's value as well as a comparison with similar homes in the area
Home Values in the Area
Average Home Value in this Area
Purchase History
| Date | Buyer | Sale Price | Title Company |
|---|---|---|---|
| Raffles Cv Llc | -- | -- | |
| 4699 Huntsman Bend Llc | -- | -- | |
| Jutan Seth | -- | -- | |
| Federal Natl Mtg Assn Fnma | -- | -- | |
| Wells Fargo Bk Na | $96,884 | -- | |
| Osborne Henry C | $127,000 | -- | |
| Lddm Llc | $94,373 | -- | |
| Warren Wilena A | $83,500 | -- |
Source: Public Records
Mortgage History
| Date | Status | Borrower | Loan Amount |
|---|---|---|---|
| Previous Owner | Osborne Henry C | $120,650 | |
| Closed | Warren Wilena A | $0 |
Source: Public Records
Tax History Compared to Growth
Tax History
| Year | Tax Paid | Tax Assessment Tax Assessment Total Assessment is a certain percentage of the fair market value that is determined by local assessors to be the total taxable value of land and additions on the property. | Land | Improvement |
|---|---|---|---|---|
| 2025 | $4,553 | $93,560 | $11,000 | $82,560 |
| 2024 | $3,369 | $66,520 | $3,991 | $62,529 |
| 2023 | $3,369 | $66,520 | $3,991 | $62,529 |
| 2022 | $2,835 | $66,520 | $4,000 | $62,520 |
| 2021 | $2,860 | $57,120 | $4,000 | $53,120 |
| 2020 | $2,686 | $53,160 | $4,000 | $49,160 |
| 2019 | $2,239 | $42,960 | $4,000 | $38,960 |
| 2018 | $1,455 | $30,800 | $2,772 | $28,028 |
| 2017 | $1,711 | $30,800 | $2,772 | $28,028 |
| 2016 | $1,194 | $32,040 | $2,880 | $29,160 |
| 2014 | $717 | $8,040 | $2,800 | $5,240 |
Source: Public Records
Map
Nearby Homes
- 4669 Huntsman Bend
- 4494 Huntsman Bend
- 4505 Wonder Valley Trail
- 4480 Raleigh Dr
- 2826 Snapfinger Manor Unit 106
- 2855 Thompson Cir
- 4716 Jakes Trail
- 2742 Snapfinger Manor Unit 128
- 4671 Jakes Trail
- 4748 Shire Dr
- 4426 Sterling Forest Dr
- 2563 Walden Lake Dr
- 2922 Snapfinger Rd
- 2566 Walden Lake Dr
- 29 Quail Run Unit B
- 4683 Thompson Mill Rd
- 18 Quail Run Unit A
- 9 Quail Run
- 2537 Walden Lake Dr
- 7 Quail Run
- 2551 Treadway Dr
- 4691 Huntsman Bend
- 2561 Treadway Dr
- 4686 Huntsman Bend
- 4686 Huntsman Bend Unit 10
- 4686 Huntsman Bend Unit 97
- 4694 Huntsman Bend
- 2564 Treadway Dr
- 4683 Huntsman Bend
- 4686 Hunstman Bend
- 2572 Treadway Dr
- 4678 Huntsman Bend Unit 1
- 4702 Huntsman Bend Unit 1
- 2569 Treadway Dr
- 4677 Huntsman Bend
- 4710 Huntsman Bend
- 2580 Treadway Dr
- 4668 Huntsman Bend
- 4719 Huntsman Bend
- 4718 Huntsman Bend Unit 1