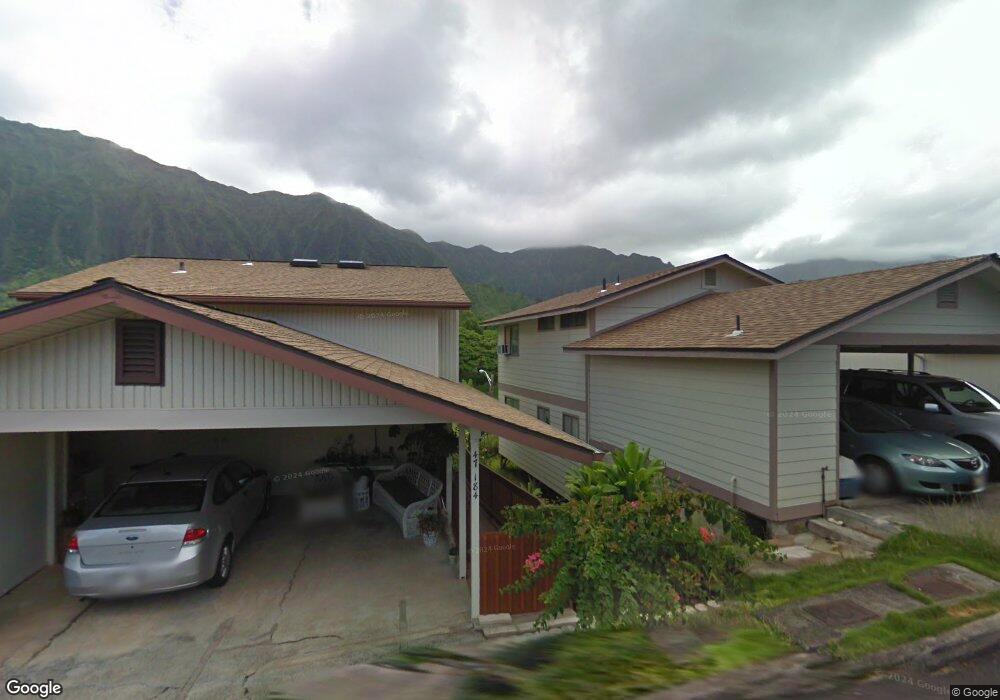
47-122 Hui Oo Place Unit 5 Kaneohe, HI 96744
Estimated Value: $799,000 - $1,081,000
3
Beds
3
Baths
1,596
Sq Ft
$556/Sq Ft
Est. Value
About This Home
This home is located at 47-122 Hui Oo Place Unit 5, Kaneohe, HI 96744 and is currently estimated at $887,487, approximately $556 per square foot. 47-122 Hui Oo Place Unit 5 is a home located in Honolulu County with nearby schools including Ahuimanu Elementary School, Governor Samuel Wilder King Intermediate School, and Castle High School.
Ownership History
Date
Name
Owned For
Owner Type
Purchase Details
Closed on
Aug 18, 2015
Sold by
Nahale Donald Keith
Bought by
Hatch Darrick Boyd and Hatch Kelli Dahle
Current Estimated Value
Home Financials for this Owner
Home Financials are based on the most recent Mortgage that was taken out on this home.
Original Mortgage
$485,000
Outstanding Balance
$381,709
Interest Rate
4.05%
Mortgage Type
New Conventional
Estimated Equity
$505,778
Purchase Details
Closed on
Feb 7, 2002
Sold by
Nahale Dorothy Frances
Bought by
Nahale Donald Keith
Home Financials for this Owner
Home Financials are based on the most recent Mortgage that was taken out on this home.
Original Mortgage
$238,500
Interest Rate
6.52%
Create a Home Valuation Report for This Property
The Home Valuation Report is an in-depth analysis detailing your home's value as well as a comparison with similar homes in the area
Home Values in the Area
Average Home Value in this Area
Purchase History
| Date | Buyer | Sale Price | Title Company |
|---|---|---|---|
| Hatch Darrick Boyd | -- | First American Title Co Inc | |
| Hatch Darrick Boyd | -- | First American Title Co Inc | |
| Nahale Donald Keith | -- | -- |
Source: Public Records
Mortgage History
| Date | Status | Borrower | Loan Amount |
|---|---|---|---|
| Open | Hatch Darrick Boyd | $485,000 | |
| Closed | Hatch Darrick Boyd | $485,000 | |
| Previous Owner | Nahale Donald Keith | $238,500 |
Source: Public Records
Tax History Compared to Growth
Tax History
| Year | Tax Paid | Tax Assessment Tax Assessment Total Assessment is a certain percentage of the fair market value that is determined by local assessors to be the total taxable value of land and additions on the property. | Land | Improvement |
|---|---|---|---|---|
| 2025 | $3,022 | $871,200 | $491,600 | $379,600 |
| 2024 | $3,022 | $863,300 | $595,800 | $267,500 |
| 2023 | $4,519 | $1,045,500 | $558,600 | $486,900 |
| 2022 | $2,812 | $803,300 | $454,300 | $349,000 |
| 2021 | $2,410 | $688,500 | $454,300 | $234,200 |
| 2020 | $2,315 | $661,500 | $391,000 | $270,500 |
| 2019 | $2,296 | $656,000 | $409,600 | $246,400 |
| 2018 | $2,284 | $652,700 | $357,500 | $295,200 |
| 2017 | $2,122 | $606,400 | $357,500 | $248,900 |
| 2016 | $2,080 | $594,200 | $357,500 | $236,700 |
| 2015 | $2,114 | $604,000 | $320,300 | $283,700 |
| 2014 | $1,569 | $534,800 | $297,900 | $236,900 |
Source: Public Records
Map
Nearby Homes
- 47-185 Hui Akepa Place Unit 41D
- 47-403 Hui Iwa St Unit 4
- 47-401 Hui Iwa St Unit 3
- 47-316C Hui Iwa St Unit 603
- 47-62 Okana Place
- 47-718 Hui Kelu St Unit 1504
- 47-712 Hui Kelu St Unit 181807
- 47-508 Hui Iwa St
- 47-681 Hui Kelu St Unit 7106
- 47-427 Ahuimanu Place
- 47-654 Hui Kelu St Unit 7601
- 47-449 Aiai Place
- 47-220 Kamehameha Hwy
- 47-323 Mawaena St
- 47-579 Nukupuu St
- 47-270 Ahuimanu Rd
- 47-325 Ahuimanu Rd
- 47-481 Ahulimanu Place Unit 1902
- 47-398 Mawaena St
- 47-544 Hakuhale St
- 47-192 Hui Oo Place Unit 2
- 47-191 Hui Oo Place Unit 37
- 47-147 Hui Oo Place Unit 25
- 47-285 Hui Oo Way Unit 32
- 47-152 Hui Oo Place Unit 11
- 47-122 Hui Oo Place Unit 19
- 47-162 Hui Oo Place Unit 9
- 47-140 Hui Oo Place Unit 15
- 47-286 Hui Oo Way Unit 33
- 47-137 Hui Oo Place Unit 22
- 47-126 Hui Oo Place Unit 18
- 47-139 Hui Oo Place Unit 23
- 47-144 Hui Oo Place Unit 14
- 47-184 Hui Oo Place Unit 4
- 47-158 Hui Oo Place Unit 10
- 47-153 Hui Oo Place Unit 27
- 47-149 Hui Oo Place Unit 26
- 47-159 Hui Oo Place
- 47-187 Hui Oo Place Unit 36
- 47-296 Hui Oo Way Unit 35