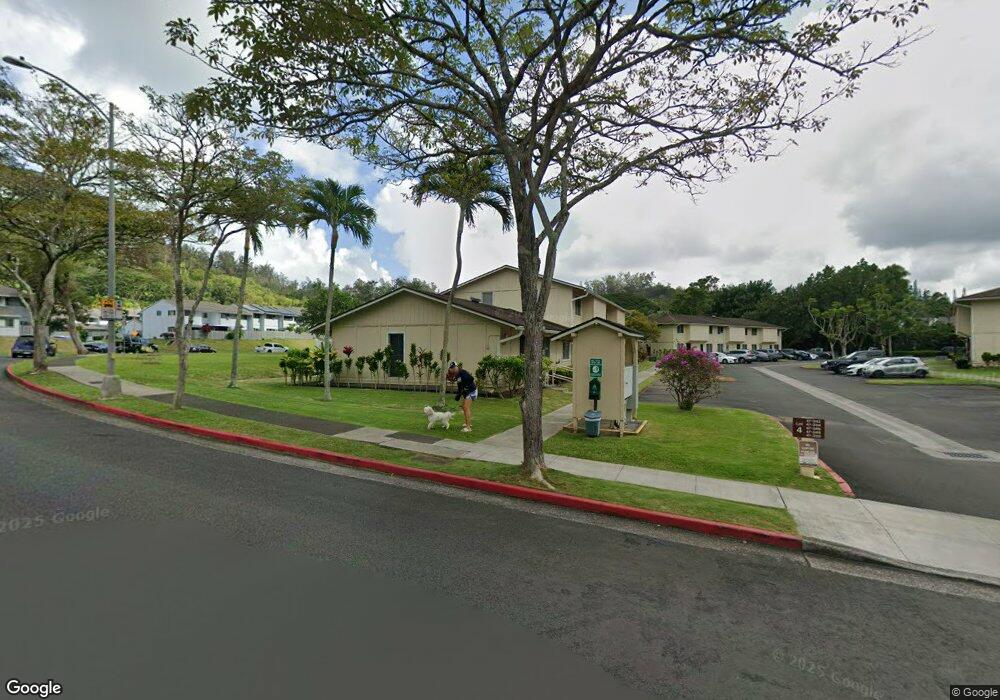
47-342 Hui Iwa St Unit A Kaneohe, HI 96744
Estimated Value: $476,000 - $653,710
3
Beds
1
Bath
988
Sq Ft
$601/Sq Ft
Est. Value
About This Home
This home is located at 47-342 Hui Iwa St Unit A, Kaneohe, HI 96744 and is currently estimated at $593,678, approximately $600 per square foot. 47-342 Hui Iwa St Unit A is a home located in Honolulu County with nearby schools including Ahuimanu Elementary School, Governor Samuel Wilder King Intermediate School, and Castle High School.
Ownership History
Date
Name
Owned For
Owner Type
Purchase Details
Closed on
Jul 26, 2023
Sold by
May Judith Fay
Bought by
Cadiente Randolph Valentino and Cadiente Corinne Ellen
Current Estimated Value
Home Financials for this Owner
Home Financials are based on the most recent Mortgage that was taken out on this home.
Original Mortgage
$325,000
Outstanding Balance
$317,428
Interest Rate
6.69%
Mortgage Type
New Conventional
Estimated Equity
$276,250
Purchase Details
Closed on
Aug 20, 2003
Sold by
Heaton George Tabor and Heaton Helen Rieko
Bought by
Jacobs Jeanne Marie and May Judith Fay
Home Financials for this Owner
Home Financials are based on the most recent Mortgage that was taken out on this home.
Original Mortgage
$198,850
Interest Rate
5.6%
Mortgage Type
Purchase Money Mortgage
Create a Home Valuation Report for This Property
The Home Valuation Report is an in-depth analysis detailing your home's value as well as a comparison with similar homes in the area
Home Values in the Area
Average Home Value in this Area
Purchase History
| Date | Buyer | Sale Price | Title Company |
|---|---|---|---|
| Cadiente Randolph Valentino | -- | Fam | |
| Jacobs Jeanne Marie | $205,000 | -- |
Source: Public Records
Mortgage History
| Date | Status | Borrower | Loan Amount |
|---|---|---|---|
| Open | Cadiente Randolph Valentino | $325,000 | |
| Previous Owner | Jacobs Jeanne Marie | $198,850 |
Source: Public Records
Tax History Compared to Growth
Tax History
| Year | Tax Paid | Tax Assessment Tax Assessment Total Assessment is a certain percentage of the fair market value that is determined by local assessors to be the total taxable value of land and additions on the property. | Land | Improvement |
|---|---|---|---|---|
| 2025 | $1,722 | $683,300 | $292,200 | $391,100 |
| 2024 | $1,722 | $652,000 | $275,000 | $377,000 |
| 2023 | $1,383 | $635,200 | $275,000 | $360,200 |
| 2022 | $1,492 | $566,400 | $261,300 | $305,100 |
| 2021 | $1,409 | $542,500 | $429,700 | $112,800 |
| 2020 | $1,311 | $514,500 | $412,500 | $102,000 |
| 2019 | $1,400 | $519,900 | $447,600 | $72,300 |
| 2018 | $1,295 | $490,100 | $411,100 | $79,000 |
| 2017 | $1,299 | $491,000 | $388,200 | $102,800 |
| 2016 | $1,164 | $452,700 | $365,400 | $87,300 |
| 2015 | $1,052 | $420,500 | $333,400 | $87,100 |
| 2014 | $828 | $414,900 | $319,700 | $95,200 |
Source: Public Records
Map
Nearby Homes
- 47-185 Hui Akepa Place Unit 41D
- 47-403 Hui Iwa St Unit 4
- 47-401 Hui Iwa St Unit 3
- 47-316C Hui Iwa St Unit 603
- 47-62 Okana Place
- 47-508 Hui Iwa St
- 47-718 Hui Kelu St Unit 1504
- 47-712 Hui Kelu St Unit 181807
- 47-681 Hui Kelu St Unit 7106
- 47-654 Hui Kelu St Unit 7601
- 47-579 Nukupuu St
- 47-427 Ahuimanu Place
- 47-449 Aiai Place
- 47-481 Ahulimanu Place Unit 1902
- 47-220 Kamehameha Hwy
- 47-323 Mawaena St
- 47-325 Ahuimanu Rd
- 47-270 Ahuimanu Rd
- 47-544 Hakuhale St
- 47-398 Mawaena St
- 47-342 Hui Iwa St Unit 117
- 47-342 Hui Iwa St Unit C
- 47-342 Hui Iwa St Unit 115
- 47-342 Hui Iwa St Unit 114
- 47-342 Hui Iwa St Unit 113
- 47-342 Hui Iwa St Unit 117
- 47-342 Hui Iwa St Unit 118
- 47-350 Hui Iwa St Unit C
- 47-350 Hui Iwa St Unit A
- 47-350 Hui Iwa St Unit D
- 47-350 Hui Iwa St Unit 105
- 47-350 Hui Iwa St Unit 104
- 47-348 Hui Iwa St Unit B101
- 47-348 Hui Iwa St Unit A
- 47-348 Hui Iwa St Unit 100
- 47-348 Hui Iwa St Unit A
- 47-344 Hui Iwa St Unit 111
- 47-344 Hui Iwa St Unit 109
- 47-344 Hui Iwa St Unit C
- 47-344 Hui Iwa St Unit A