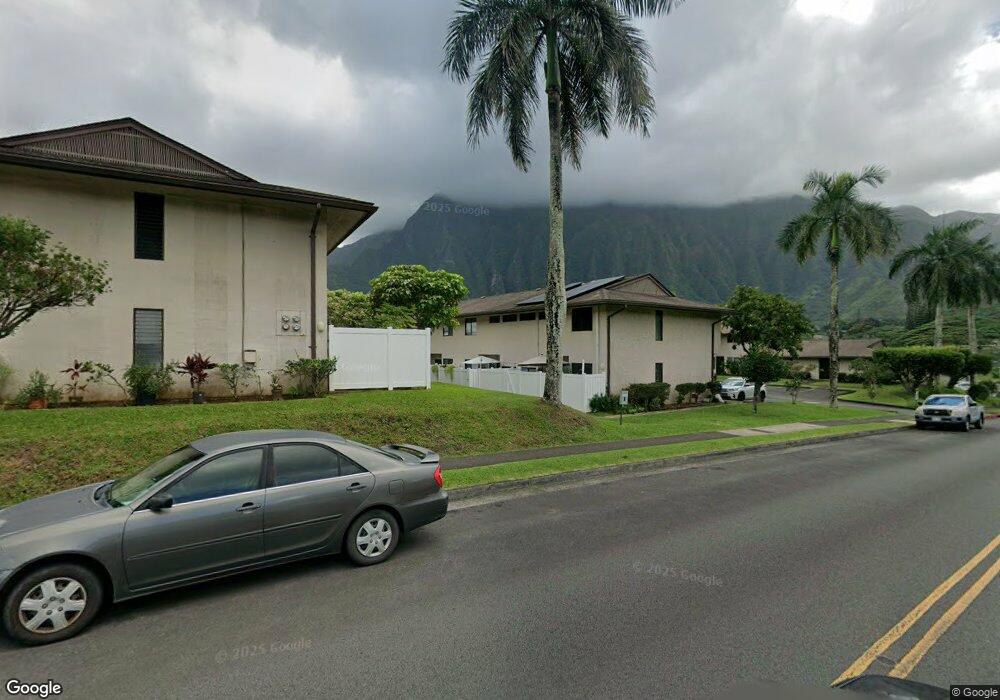
47-408 Hui Iwa St Unit 3 Kaneohe, HI 96744
Estimated Value: $657,000 - $738,000
3
Beds
3
Baths
1,290
Sq Ft
$537/Sq Ft
Est. Value
About This Home
This home is located at 47-408 Hui Iwa St Unit 3, Kaneohe, HI 96744 and is currently estimated at $692,691, approximately $536 per square foot. 47-408 Hui Iwa St Unit 3 is a home located in Honolulu County with nearby schools including Ahuimanu Elementary School, Governor Samuel Wilder King Intermediate School, and Castle High School.
Ownership History
Date
Name
Owned For
Owner Type
Purchase Details
Closed on
Feb 11, 2019
Sold by
Seo Kent Lopaka and Seo Valerie Midori Uwaine
Bought by
Seo Kent L and Seo Valerie M U
Current Estimated Value
Purchase Details
Closed on
Jul 19, 2012
Sold by
Livin Murata Michael M
Bought by
Uwaine Seo Kent Lopaka and Uwaine Seo Valerie Midori
Home Financials for this Owner
Home Financials are based on the most recent Mortgage that was taken out on this home.
Original Mortgage
$419,800
Outstanding Balance
$289,507
Interest Rate
3.65%
Estimated Equity
$403,184
Purchase Details
Closed on
Aug 27, 1997
Sold by
Murata Craig Shoichi
Bought by
Livin Murata Craig S and Craig S Murata Revocable Living Trust
Create a Home Valuation Report for This Property
The Home Valuation Report is an in-depth analysis detailing your home's value as well as a comparison with similar homes in the area
Home Values in the Area
Average Home Value in this Area
Purchase History
| Date | Buyer | Sale Price | Title Company |
|---|---|---|---|
| Seo Kent L | -- | None Available | |
| Seo Kent L | -- | None Available | |
| Seo Kent L | -- | None Available | |
| Uwaine Seo Kent Lopaka | $410,000 | Fntic | |
| Uwaine Seo Kent Lopaka | $410,000 | Fntic | |
| Livin Murata Craig S | -- | -- |
Source: Public Records
Mortgage History
| Date | Status | Borrower | Loan Amount |
|---|---|---|---|
| Open | Uwaine Seo Kent Lopaka | $419,800 | |
| Closed | Uwaine Seo Kent Lopaka | $419,800 |
Source: Public Records
Tax History Compared to Growth
Tax History
| Year | Tax Paid | Tax Assessment Tax Assessment Total Assessment is a certain percentage of the fair market value that is determined by local assessors to be the total taxable value of land and additions on the property. | Land | Improvement |
|---|---|---|---|---|
| 2025 | $2,119 | $733,000 | $228,900 | $504,100 |
| 2024 | $2,119 | $725,300 | $215,400 | $509,900 |
| 2023 | $1,723 | $692,400 | $215,400 | $477,000 |
| 2022 | $1,701 | $586,000 | $204,600 | $381,400 |
| 2021 | $1,654 | $572,500 | $325,500 | $247,000 |
| 2020 | $1,630 | $565,700 | $312,500 | $253,200 |
| 2019 | $1,702 | $566,200 | $338,800 | $227,400 |
| 2018 | $1,612 | $540,600 | $311,100 | $229,500 |
| 2017 | $1,628 | $545,100 | $293,800 | $251,300 |
| 2016 | $1,338 | $462,400 | $276,500 | $185,900 |
| 2015 | $1,256 | $438,800 | $252,300 | $186,500 |
| 2014 | $1,028 | $484,400 | $242,000 | $242,400 |
Source: Public Records
Map
Nearby Homes
- 47-316C Hui Iwa St Unit 603
- 47-401 Hui Iwa St Unit 3
- 47-403 Hui Iwa St Unit 4
- 47-185 Hui Akepa Place Unit 41D
- 47-508 Hui Iwa St
- 47-718 Hui Kelu St Unit 1504
- 47-681 Hui Kelu St Unit 7106
- 47-712 Hui Kelu St Unit 181807
- 47-62 Okana Place
- 47-654 Hui Kelu St Unit 7601
- 47-579 Nukupuu St
- 47-427 Ahuimanu Place
- 47-449 Aiai Place
- 47-481 Ahulimanu Place Unit 1902
- 47-544 Hakuhale St
- 47-325 Ahuimanu Rd
- 47-270 Ahuimanu Rd
- 47-323 Mawaena St
- 47-220 Kamehameha Hwy
- 47-646 Melekula Rd
- 47-408 Hui Iwa St Unit 1
- 47-408 Hui Iwa St Unit 4
- 47-408 Hui Iwa St Unit 2
- 47-408 Hui Iwa St Unit 2/7
- 47-414 Hui Iwa St Unit 3
- 47-414 Hui Iwa St Unit 4
- 47-414 Hui Iwa St Unit 1
- 47-414 Hui Iwa St Unit 1/10
- 47-414 Hui Iwa St Unit 1/10 3
- 47-406 Hui Iwa St Unit 210
- 47-406 Hui Iwa St Unit 1
- 47-316A Hui Iwa St Unit 601
- 47-316D Hui Iwa St Unit 604
- 47-316B Hui Iwa St Unit 602
- 47-410 Hui Iwa St Unit 1
- 47-410 Hui Iwa St Unit 2
- 47-404 Hui Iwa St Unit 4
- 47-404 Hui Iwa St Unit 1
- 47-404 Hui Iwa St Unit 3
- 47-404 Hui Iwa St Unit 2