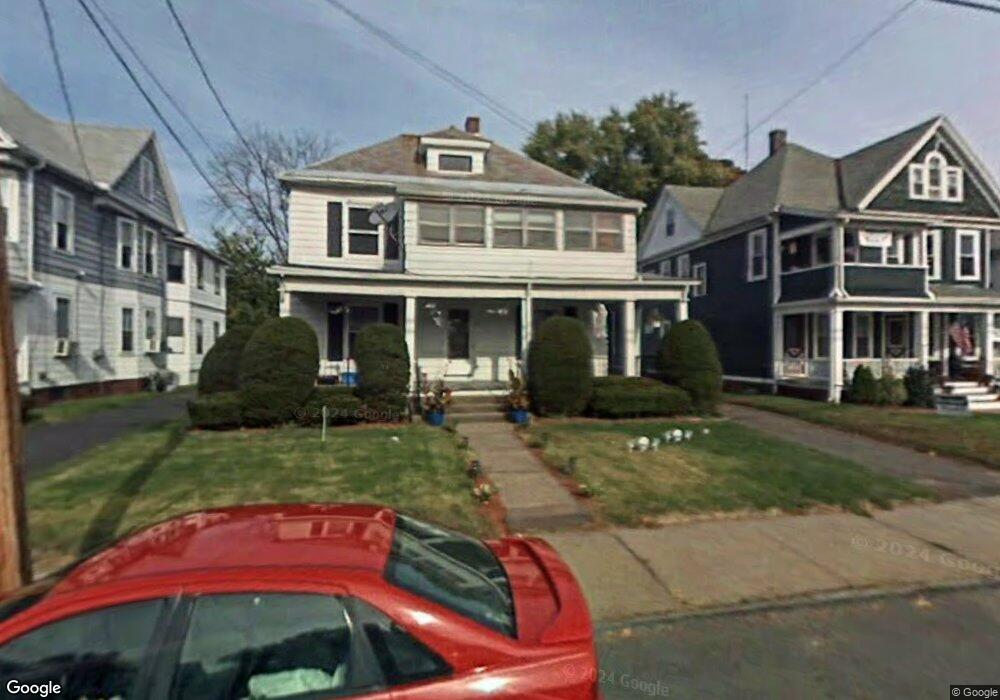
47-49 Hitchcock St Holyoke, MA 01040
Estimated Value: $336,000 - $385,000
4
Beds
2
Baths
2,070
Sq Ft
$173/Sq Ft
Est. Value
About This Home
This home is located at 47-49 Hitchcock St, Holyoke, MA 01040 and is currently estimated at $358,710, approximately $173 per square foot. 47-49 Hitchcock St is a home located in Hampden County with nearby schools including Maurice A. Donahue Elementary School, Holyoke High School, and Holyoke Community Charter School.
Ownership History
Date
Name
Owned For
Owner Type
Purchase Details
Closed on
Feb 2, 2018
Sold by
Brunelle Deborah J
Bought by
Machuca Chevonne and Stiles Patricia A
Current Estimated Value
Home Financials for this Owner
Home Financials are based on the most recent Mortgage that was taken out on this home.
Original Mortgage
$192,449
Outstanding Balance
$161,994
Interest Rate
3.75%
Mortgage Type
FHA
Estimated Equity
$196,716
Purchase Details
Closed on
Aug 28, 2017
Sold by
Bank Of New York Mello
Bought by
Brunelle Deborah J
Purchase Details
Closed on
Oct 20, 2016
Sold by
Labelle Christopher P
Bought by
Bank Of New York Mello
Purchase Details
Closed on
Oct 2, 2000
Sold by
Salois Marilyn
Bought by
Labelle Christopher P
Home Financials for this Owner
Home Financials are based on the most recent Mortgage that was taken out on this home.
Original Mortgage
$101,948
Interest Rate
7.94%
Mortgage Type
Purchase Money Mortgage
Create a Home Valuation Report for This Property
The Home Valuation Report is an in-depth analysis detailing your home's value as well as a comparison with similar homes in the area
Home Values in the Area
Average Home Value in this Area
Purchase History
| Date | Buyer | Sale Price | Title Company |
|---|---|---|---|
| Machuca Chevonne | $196,000 | -- | |
| Brunelle Deborah J | $95,500 | -- | |
| Bank Of New York Mello | $132,000 | -- | |
| Labelle Christopher P | $102,000 | -- |
Source: Public Records
Mortgage History
| Date | Status | Borrower | Loan Amount |
|---|---|---|---|
| Open | Machuca Chevonne | $192,449 | |
| Previous Owner | Labelle Christopher P | $101,948 |
Source: Public Records
Tax History Compared to Growth
Tax History
| Year | Tax Paid | Tax Assessment Tax Assessment Total Assessment is a certain percentage of the fair market value that is determined by local assessors to be the total taxable value of land and additions on the property. | Land | Improvement |
|---|---|---|---|---|
| 2025 | $5,542 | $317,400 | $42,800 | $274,600 |
| 2024 | $5,126 | $270,500 | $40,900 | $229,600 |
| 2023 | $4,718 | $251,500 | $40,900 | $210,600 |
| 2022 | $4,738 | $246,000 | $40,900 | $205,100 |
| 2021 | $4,105 | $213,000 | $37,300 | $175,700 |
| 2020 | $3,805 | $199,400 | $37,300 | $162,100 |
| 2019 | $3,723 | $193,000 | $37,300 | $155,700 |
| 2018 | $2,944 | $153,900 | $37,300 | $116,600 |
| 2017 | $3,399 | $177,300 | $37,300 | $140,000 |
| 2016 | $3,296 | $172,400 | $38,300 | $134,100 |
| 2015 | $3,282 | $172,400 | $38,300 | $134,100 |
Source: Public Records
Map
Nearby Homes
- 47 Hitchcock St Unit 49
- 41 Hitchcock St Unit 43
- 51-53 Hitchcock St
- 51 Hitchcock St Unit 53
- 37 Hitchcock St Unit 39
- 36 Westfield Rd Unit 38
- 34 Westfield Rd
- 33-35 Hitchcock St Unit 2
- 33-35 Hitchcock St Unit 1
- 40 Westfield Rd Unit 42
- 33 Hitchcock St Unit 35
- 57 Hitchcock St
- 42 Hitchcock St Unit 44
- 40 Hitchcock St
- 26 Westfield Rd Unit 28
- 26-28 Wrestfield Rd
- 48 Hitchcock St
- 44 Westfield Rd Unit 46
- 50-52 Hitchcock St
- 50 Hitchcock St Unit 52