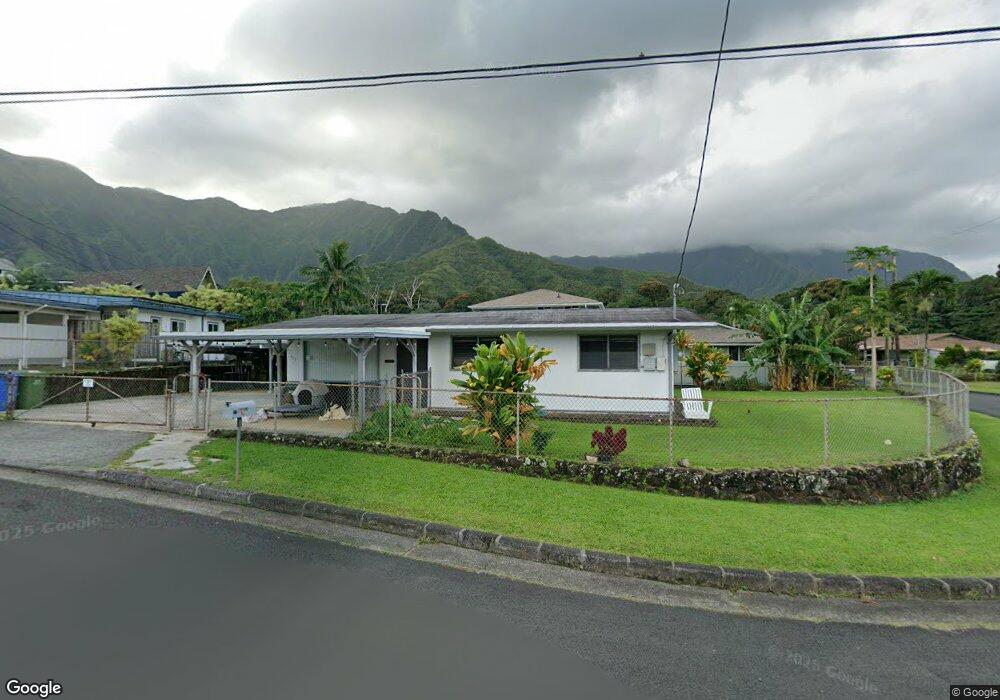
47-493 Apau Loop Kaneohe, HI 96744
Estimated Value: $918,000 - $1,036,000
3
Beds
2
Baths
912
Sq Ft
$1,049/Sq Ft
Est. Value
About This Home
This home is located at 47-493 Apau Loop, Kaneohe, HI 96744 and is currently estimated at $956,632, approximately $1,048 per square foot. 47-493 Apau Loop is a home located in Honolulu County with nearby schools including Kahaluu Elementary School, Governor Samuel Wilder King Intermediate School, and Castle High School.
Ownership History
Date
Name
Owned For
Owner Type
Purchase Details
Closed on
Dec 30, 2019
Sold by
Mahelona Patrick Jason Hina I and Mahelona Jennifer Ann
Bought by
Mahelona Patrick J H and Mahelona Jennifer A
Current Estimated Value
Purchase Details
Closed on
Oct 24, 2001
Sold by
Martin George William and Martin Faith Kanoohokahi
Bought by
Mahelona Patrick Jason Hinai and Mahelona Jennifer Ann
Home Financials for this Owner
Home Financials are based on the most recent Mortgage that was taken out on this home.
Original Mortgage
$196,644
Outstanding Balance
$76,692
Interest Rate
6.84%
Estimated Equity
$879,940
Create a Home Valuation Report for This Property
The Home Valuation Report is an in-depth analysis detailing your home's value as well as a comparison with similar homes in the area
Home Values in the Area
Average Home Value in this Area
Purchase History
| Date | Buyer | Sale Price | Title Company |
|---|---|---|---|
| Mahelona Patrick J H | -- | None Available | |
| Mahelona Patrick J H | -- | None Available | |
| Mahelona Patrick J H | -- | None Available | |
| Mahelona Patrick Jason Hinai | $214,000 | -- |
Source: Public Records
Mortgage History
| Date | Status | Borrower | Loan Amount |
|---|---|---|---|
| Open | Mahelona Patrick Jason Hinai | $196,644 |
Source: Public Records
Tax History Compared to Growth
Tax History
| Year | Tax Paid | Tax Assessment Tax Assessment Total Assessment is a certain percentage of the fair market value that is determined by local assessors to be the total taxable value of land and additions on the property. | Land | Improvement |
|---|---|---|---|---|
| 2025 | $2,670 | $876,900 | $779,300 | $97,600 |
| 2024 | $2,670 | $882,800 | $779,300 | $103,500 |
| 2023 | $2,383 | $880,900 | $726,700 | $154,200 |
| 2022 | $2,262 | $746,200 | $631,900 | $114,300 |
| 2021 | $2,226 | $736,000 | $631,900 | $104,100 |
| 2020 | $2,142 | $712,100 | $574,000 | $138,100 |
| 2019 | $2,240 | $720,000 | $605,600 | $114,400 |
| 2018 | $2,097 | $679,100 | $505,500 | $173,600 |
| 2017 | $1,905 | $624,200 | $489,700 | $134,500 |
| 2016 | $1,758 | $582,300 | $468,700 | $113,600 |
| 2015 | $1,897 | $622,100 | $484,500 | $137,600 |
| 2014 | -- | $585,200 | $421,300 | $163,900 |
Source: Public Records
Map
Nearby Homes
- 47-544 Hakuhale St
- 47-481 Ahulimanu Place Unit 1902
- 47-449 Aiai Place
- 47-427 Ahuimanu Place
- Lot 14 Ahaolelo Rd
- 47-254 Ahaolelo Rd
- 47-646 Melekula Rd
- 47-325 Ahuimanu Rd
- 47-718 Hui Kelu St Unit 1504
- 47-712 Hui Kelu St Unit 181807
- 47-546 Mapele Place Unit B
- 47-654 Hui Kelu St Unit 7601
- 47-681 Hui Kelu St Unit 7106
- 47-546-E Mapele Place Unit A
- 47-62 Okana Place
- 47-270 Ahuimanu Rd
- 47-508 Hui Iwa St
- 47-403 Hui Iwa St Unit 4
- 47-401 Hui Iwa St Unit 3
- 47-316C Hui Iwa St Unit 603
- 47-504 Hio Place
- 47-495 Apau Loop
- 47-506 Hio Place
- 47-503 Hio Place
- 47-494 Apau Loop
- 47-488 Apau Loop
- 47-487 Apau Loop
- 47-499 Apau Loop
- 47-512 Hio Place
- 47-507 Hio Place
- 47-502 Apau Loop Unit 2207
- 47-510 Hio Place
- 47-484 Apau Loop
- 47-503 Apau Loop
- 47-508 Hio Place
- 47-511 Hio Place
- 47-483 Apau Loop
- 47-482 Apau Loop
- 47-516 Hio Place
- 47-506 Apau Loop