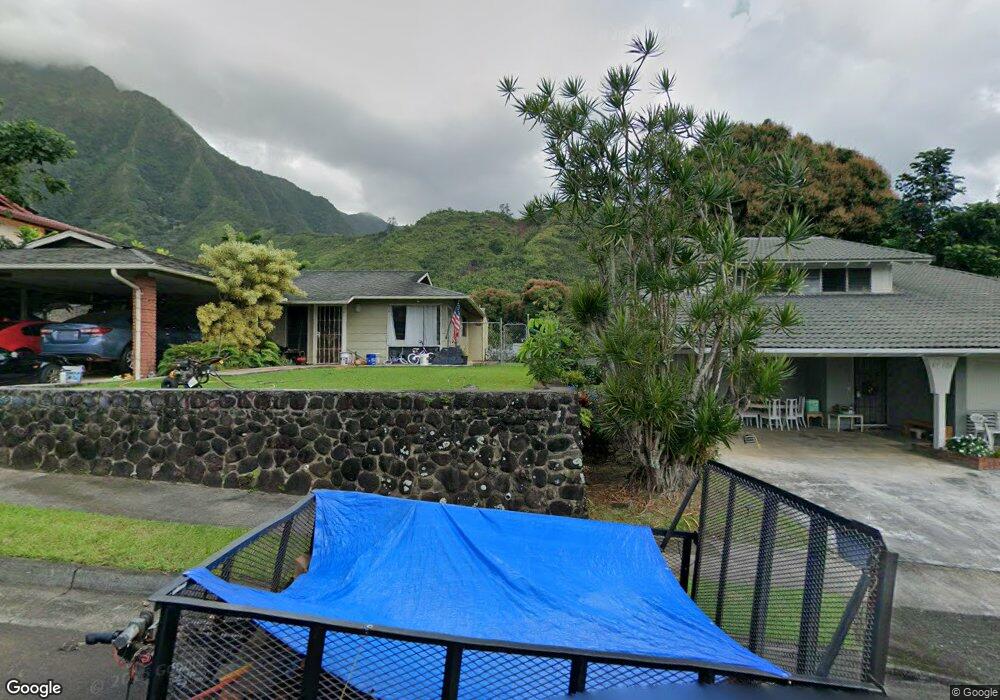
47-608 Hui Ulili St Unit A Kaneohe, HI 96744
Estimated Value: $1,245,926 - $1,960,000
3
Beds
3
Baths
2,061
Sq Ft
$740/Sq Ft
Est. Value
About This Home
This home is located at 47-608 Hui Ulili St Unit A, Kaneohe, HI 96744 and is currently estimated at $1,525,732, approximately $740 per square foot. 47-608 Hui Ulili St Unit A is a home located in Honolulu County with nearby schools including Ahuimanu Elementary School, Governor Samuel Wilder King Intermediate School, and Castle High School.
Ownership History
Date
Name
Owned For
Owner Type
Purchase Details
Closed on
May 31, 2014
Sold by
Awana John Keolalani and Awana Donna Lei
Bought by
The Awana Joint Trust
Current Estimated Value
Home Financials for this Owner
Home Financials are based on the most recent Mortgage that was taken out on this home.
Original Mortgage
$522,825
Outstanding Balance
$398,419
Interest Rate
4.25%
Mortgage Type
Adjustable Rate Mortgage/ARM
Estimated Equity
$1,127,313
Purchase Details
Closed on
May 13, 2011
Sold by
Awana John Keolalani and Awana Donna Lei
Bought by
Awana John Keolalani and Awana Donna Lei
Purchase Details
Closed on
Jul 10, 2000
Sold by
Y B Investments Inc
Bought by
Awana John Keolalani and Awana Donna Lei
Home Financials for this Owner
Home Financials are based on the most recent Mortgage that was taken out on this home.
Original Mortgage
$358,400
Interest Rate
8.55%
Create a Home Valuation Report for This Property
The Home Valuation Report is an in-depth analysis detailing your home's value as well as a comparison with similar homes in the area
Home Values in the Area
Average Home Value in this Area
Purchase History
| Date | Buyer | Sale Price | Title Company |
|---|---|---|---|
| The Awana Joint Trust | -- | Accommodation | |
| Awana John Keolalani | -- | Accommodation | |
| The Awana Joint Trust | -- | Accommodation | |
| Awana John Keolalani | -- | Accommodation | |
| Awana John Keolalani | -- | None Available | |
| Awana John Keolalani | $448,000 | -- |
Source: Public Records
Mortgage History
| Date | Status | Borrower | Loan Amount |
|---|---|---|---|
| Open | Awana John Keolalani | $522,825 | |
| Closed | Awana John Keolalani | $522,825 | |
| Closed | Awana John Keolalani | $358,400 |
Source: Public Records
Tax History Compared to Growth
Tax History
| Year | Tax Paid | Tax Assessment Tax Assessment Total Assessment is a certain percentage of the fair market value that is determined by local assessors to be the total taxable value of land and additions on the property. | Land | Improvement |
|---|---|---|---|---|
| 2025 | $3,841 | $1,332,200 | $821,100 | $511,100 |
| 2024 | $3,841 | $1,257,500 | $782,000 | $475,500 |
| 2023 | $3,716 | $1,301,800 | $742,900 | $558,900 |
| 2022 | $3,260 | $1,071,400 | $573,400 | $498,000 |
| 2021 | $2,800 | $940,100 | $573,400 | $366,700 |
| 2020 | $2,719 | $916,800 | $521,300 | $395,500 |
| 2019 | $2,974 | $929,800 | $540,900 | $388,900 |
| 2018 | $2,959 | $925,500 | $443,100 | $482,400 |
| 2017 | $2,679 | $845,500 | $436,600 | $408,900 |
| 2016 | $2,541 | $806,000 | $397,500 | $408,500 |
| 2015 | $2,536 | $804,600 | $391,000 | $413,600 |
| 2014 | $2,105 | $758,300 | $391,000 | $367,300 |
Source: Public Records
Map
Nearby Homes
- 47-129 Heno Place
- 47-654 Hui Kelu St Unit 7601
- 47-681 Hui Kelu St Unit 7106
- 47-685 Hui Ulili St
- 47-508 Hui Iwa St
- 47-718 Hui Kelu St Unit 1504
- 47-724 Hui Kelu St Unit 1
- 47-564 Alawiki St
- 47-541 Alawiki St
- 47-535 Alawiki St
- 47-544 Hakuhale St
- 47-646 Melekula Rd
- 47-405 Hui Iwa St Unit 6-6
- 47-449 Aiai Place
- 47-427 Ahuimanu Place
- 47-62 Okana Place
- 47-227 Okana Rd
- 47-388 Keohapa Place
- 47-039 Okana Place
- Lot 14 Ahaolelo Rd
- 47-608 Hui Ulili St Unit B
- 47-608 Hui Ulili St Unit D
- 47-608 Hui Ulili St Unit C
- 47-608 Hui Ulili St
- 47-600 Hui Ulili St
- 47-598 Hui Ulili St
- 47-602 Hui Ulili St
- 47-606 Hui Ulili St
- 47-596 Hui Ulili St
- 47-518 Hui Kelu St
- 47-522 Hui Kelu St
- 47-534 Hui Kelu St
- 47-514 Hui Kelu St
- 47-594 Hui Ulili St
- 47-540 Hui Kelu St
- 47-508 Hui Kelu St
- 47-612 Hui Ulili St
- 47-95 Aka Place
- 47-601 Hui Ulili St
- 47-603 Hui Ulili St