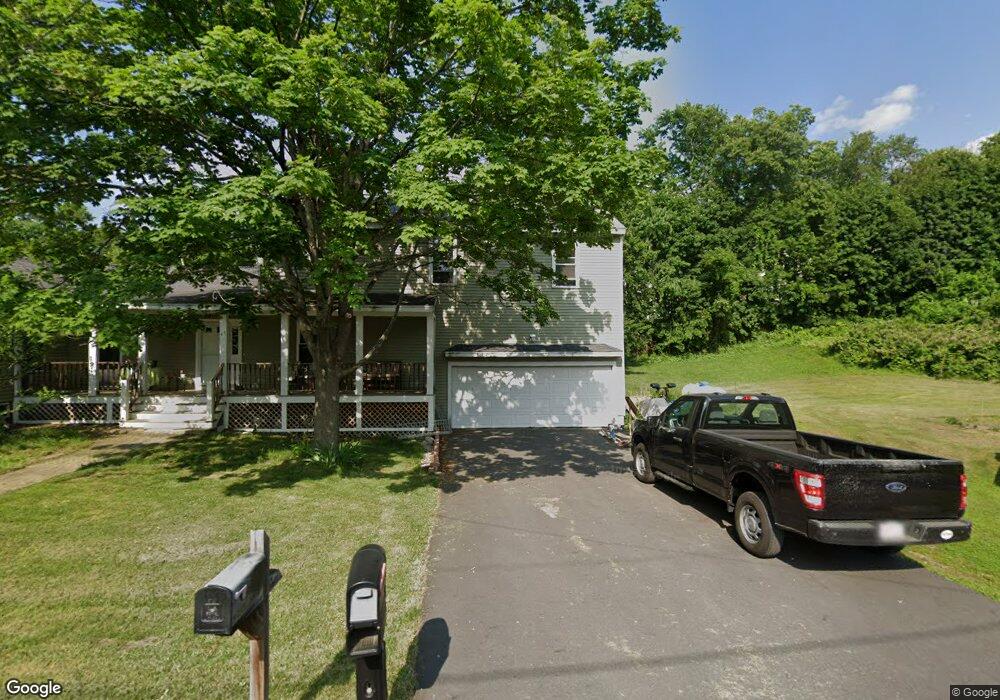
47 Albermarle Ave Dracut, MA 01826
Estimated Value: $625,000 - $740,000
4
Beds
2
Baths
2,566
Sq Ft
$266/Sq Ft
Est. Value
About This Home
This home is located at 47 Albermarle Ave, Dracut, MA 01826 and is currently estimated at $683,190, approximately $266 per square foot. 47 Albermarle Ave is a home located in Middlesex County with nearby schools including George H. Englesby Elementary School, Richardson Middle School, and Dracut Senior High School.
Ownership History
Date
Name
Owned For
Owner Type
Purchase Details
Closed on
Aug 28, 2012
Sold by
Landry Frank
Bought by
Landry Francis G and Landry Gayle
Current Estimated Value
Purchase Details
Closed on
Apr 7, 2011
Sold by
Us Bank Na
Bought by
Landry Frank
Purchase Details
Closed on
Sep 15, 2010
Sold by
Jensen Mark W
Bought by
Us Bk
Purchase Details
Closed on
Jun 18, 2002
Sold by
Dalton Stephen J and Dalton Linda M
Bought by
Jensen Mark W and Jensen Lisa B
Home Financials for this Owner
Home Financials are based on the most recent Mortgage that was taken out on this home.
Original Mortgage
$145,999
Interest Rate
6.8%
Mortgage Type
Purchase Money Mortgage
Purchase Details
Closed on
Dec 13, 1996
Sold by
Andrews James
Bought by
Dalton Stephen J
Purchase Details
Closed on
Nov 16, 1995
Sold by
Andrews Barbara
Bought by
Andrews James
Create a Home Valuation Report for This Property
The Home Valuation Report is an in-depth analysis detailing your home's value as well as a comparison with similar homes in the area
Home Values in the Area
Average Home Value in this Area
Purchase History
| Date | Buyer | Sale Price | Title Company |
|---|---|---|---|
| Landry Francis G | -- | -- | |
| Landry Frank | $185,200 | -- | |
| Us Bk | $312,000 | -- | |
| Jensen Mark W | $145,999 | -- | |
| Dalton Stephen J | $79,900 | -- | |
| Andrews James | $62,000 | -- |
Source: Public Records
Mortgage History
| Date | Status | Borrower | Loan Amount |
|---|---|---|---|
| Previous Owner | Andrews James | $120,000 | |
| Previous Owner | Andrews James | $145,903 | |
| Previous Owner | Andrews James | $145,999 | |
| Previous Owner | Andrews James | $78,300 |
Source: Public Records
Tax History
| Year | Tax Paid | Tax Assessment Tax Assessment Total Assessment is a certain percentage of the fair market value that is determined by local assessors to be the total taxable value of land and additions on the property. | Land | Improvement |
|---|---|---|---|---|
| 2025 | $6,403 | $632,700 | $229,900 | $402,800 |
| 2024 | $6,399 | $612,300 | $219,100 | $393,200 |
| 2023 | $6,115 | $528,100 | $190,600 | $337,500 |
| 2022 | $6,278 | $510,800 | $173,300 | $337,500 |
| 2021 | $6,052 | $465,200 | $157,400 | $307,800 |
| 2020 | $6,069 | $454,600 | $152,700 | $301,900 |
| 2019 | $5,515 | $401,100 | $145,400 | $255,700 |
| 2018 | $1,967 | $381,300 | $145,400 | $235,900 |
| 2017 | $5,042 | $381,300 | $145,400 | $235,900 |
| 2016 | $4,869 | $328,100 | $139,700 | $188,400 |
| 2015 | $4,633 | $310,300 | $139,700 | $170,600 |
| 2014 | $3,996 | $275,800 | $139,700 | $136,100 |
Source: Public Records
Map
Nearby Homes
- 1905 Lakeview Ave
- 17 Spare St
- 53 Vinal St
- 29 Mill St Unit B
- 13 Dallas Dr Unit 305
- 13 Dallas Dr Unit 107
- 83 Turgeon Ave
- 124 Tennis Plaza Rd Unit 40
- 154 New Boston Rd
- 74 Tennis Plaza Rd Unit 34
- 94 Tennis Plaza Rd Unit 10
- 9 Cornstalk Ln
- 43 & 53 5th St
- 42 Frederick St Unit 9
- 91 Frederick St Unit 77
- 9 Arbor Dr
- 70 Faith Ave
- 19 Louis Farm Rd Unit 19
- 13 Louis Farm Rd Unit 13
- 15 Louis Farm Rd Unit 15
- 53 Albermarle Ave
- 32 Hillcrest Ave
- 30 Hillcrest Ave
- 34 Hillcrest Ave
- 54 Albermarle Ave
- 28 Hillcrest Ave
- 38 Hillcrest Ave
- 26 Hillcrest Ave
- 16 Beaver Brook St
- 24 Hillcrest Ave
- 32 Beaver Brook St
- 70 Oxford Rd
- 22 Hillcrest Ave
- 17 Cameron Ave
- 34 Cameron Ave
- 20 Hillcrest Ave
- 35 Hillcrest Ave
- 118120 Primrose Hill Rd
- 63 Oxford Rd
- 50 Beaver Brook Ln
Your Personal Tour Guide
Ask me questions while you tour the home.