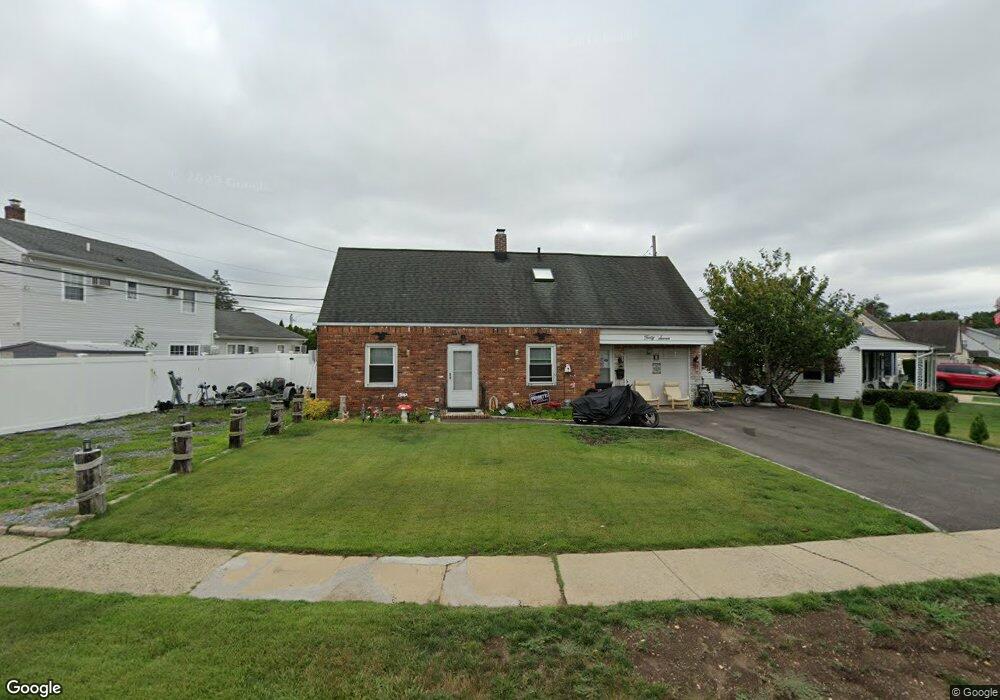
47 Andrew Ln Levittown, NY 11756
Estimated Value: $644,414 - $695,000
--
Bed
1
Bath
1,481
Sq Ft
$452/Sq Ft
Est. Value
About This Home
This home is located at 47 Andrew Ln, Levittown, NY 11756 and is currently estimated at $669,707, approximately $452 per square foot. 47 Andrew Ln is a home located in Nassau County with nearby schools including Summit Lane School, Wisdom Lane Middle School, and Division Avenue Senior High School.
Ownership History
Date
Name
Owned For
Owner Type
Purchase Details
Closed on
Dec 10, 2020
Sold by
Slippel John E and Slippel John E
Bought by
Slippel John E
Current Estimated Value
Home Financials for this Owner
Home Financials are based on the most recent Mortgage that was taken out on this home.
Original Mortgage
$355,768
Outstanding Balance
$317,304
Interest Rate
2.8%
Mortgage Type
FHA
Estimated Equity
$352,403
Purchase Details
Closed on
Apr 8, 2019
Sold by
Zinser Louis A and Zinser Priscilla L
Bought by
Sippel John E and Sippel John E
Home Financials for this Owner
Home Financials are based on the most recent Mortgage that was taken out on this home.
Original Mortgage
$338,259
Interest Rate
4.42%
Mortgage Type
FHA
Purchase Details
Closed on
Jul 25, 2016
Sold by
Zinser Louis A and Zinser Joan S
Bought by
Zinser Louis A and Zinser Priscilla L
Create a Home Valuation Report for This Property
The Home Valuation Report is an in-depth analysis detailing your home's value as well as a comparison with similar homes in the area
Home Values in the Area
Average Home Value in this Area
Purchase History
| Date | Buyer | Sale Price | Title Company |
|---|---|---|---|
| Slippel John E | -- | Old Republic Title | |
| Sippel John E | $344,500 | None Available | |
| Zinser Louis A | -- | None Available |
Source: Public Records
Mortgage History
| Date | Status | Borrower | Loan Amount |
|---|---|---|---|
| Open | Slippel John E | $355,768 | |
| Closed | Sippel John E | $338,259 |
Source: Public Records
Tax History Compared to Growth
Tax History
| Year | Tax Paid | Tax Assessment Tax Assessment Total Assessment is a certain percentage of the fair market value that is determined by local assessors to be the total taxable value of land and additions on the property. | Land | Improvement |
|---|---|---|---|---|
| 2025 | $13,355 | $406 | $247 | $159 |
| 2024 | $3,240 | $386 | $247 | $139 |
| 2023 | $12,062 | $386 | $247 | $139 |
| 2022 | $12,062 | $365 | $247 | $118 |
| 2021 | $15,431 | $345 | $210 | $135 |
| 2020 | $10,873 | $598 | $478 | $120 |
| 2019 | $3,993 | $659 | $527 | $132 |
| 2018 | $10,371 | $659 | $0 | $0 |
| 2017 | $8,020 | $659 | $527 | $132 |
| 2016 | $11,159 | $659 | $527 | $132 |
| 2015 | $2,870 | $659 | $527 | $132 |
| 2014 | $2,870 | $659 | $527 | $132 |
| 2013 | $2,636 | $659 | $527 | $132 |
Source: Public Records
Map
Nearby Homes