47 Ashford Dr Cranberry Township, PA 16066
Estimated Value: $212,131 - $334,000
2
Beds
2
Baths
1,452
Sq Ft
$192/Sq Ft
Est. Value
About This Home
This home is located at 47 Ashford Dr, Cranberry Township, PA 16066 and is currently estimated at $279,283, approximately $192 per square foot. 47 Ashford Dr is a home located in Butler County with nearby schools including Haine Middle School, Haine Elementary School, and Ryan Gloyer Middle School.
Ownership History
Date
Name
Owned For
Owner Type
Purchase Details
Closed on
May 29, 2013
Sold by
Waddingham Merle J
Bought by
Fandray James M
Current Estimated Value
Home Financials for this Owner
Home Financials are based on the most recent Mortgage that was taken out on this home.
Original Mortgage
$129,600
Outstanding Balance
$92,025
Interest Rate
3.45%
Mortgage Type
New Conventional
Estimated Equity
$187,258
Purchase Details
Closed on
May 4, 2011
Sold by
Schafer Suzanne P and Magill William L
Bought by
Waddingham Merle J
Home Financials for this Owner
Home Financials are based on the most recent Mortgage that was taken out on this home.
Original Mortgage
$56,500
Interest Rate
4.88%
Mortgage Type
New Conventional
Purchase Details
Closed on
Jun 15, 2004
Sold by
Schafer Suzanne P
Bought by
Schafer Suzanne P
Purchase Details
Closed on
Sep 25, 2003
Sold by
Blank Dewitt B
Bought by
Mcgill William L
Create a Home Valuation Report for This Property
The Home Valuation Report is an in-depth analysis detailing your home's value as well as a comparison with similar homes in the area
Home Values in the Area
Average Home Value in this Area
Purchase History
| Date | Buyer | Sale Price | Title Company |
|---|---|---|---|
| Fandray James M | $167,250 | -- | |
| Waddingham Merle J | $156,500 | -- | |
| Schafer Suzanne P | -- | -- | |
| Mcgill William L | $145,000 | -- |
Source: Public Records
Mortgage History
| Date | Status | Borrower | Loan Amount |
|---|---|---|---|
| Open | Fandray James M | $129,600 | |
| Previous Owner | Waddingham Merle J | $56,500 |
Source: Public Records
Tax History Compared to Growth
Tax History
| Year | Tax Paid | Tax Assessment Tax Assessment Total Assessment is a certain percentage of the fair market value that is determined by local assessors to be the total taxable value of land and additions on the property. | Land | Improvement |
|---|---|---|---|---|
| 2025 | $3,454 | $19,274 | $273 | $19,001 |
| 2024 | $3,351 | $19,274 | $273 | $19,001 |
| 2023 | $3,302 | $19,274 | $273 | $19,001 |
| 2022 | $3,302 | $19,274 | $273 | $19,001 |
| 2021 | $3,253 | $19,274 | $0 | $0 |
| 2020 | $3,253 | $19,274 | $273 | $19,001 |
| 2019 | $3,216 | $19,274 | $273 | $19,001 |
| 2018 | $3,216 | $19,274 | $273 | $19,001 |
| 2017 | $3,159 | $19,274 | $273 | $19,001 |
| 2016 | $867 | $19,274 | $273 | $19,001 |
| 2015 | $391 | $19,274 | $273 | $19,001 |
| 2014 | $391 | $19,274 | $273 | $19,001 |
Source: Public Records
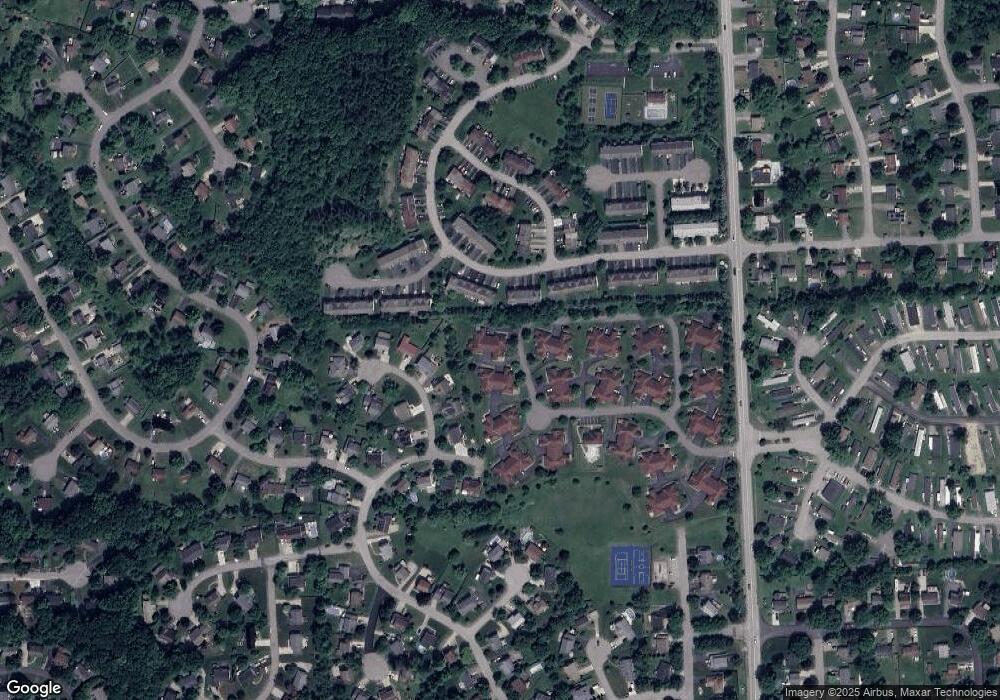
Map
Nearby Homes
- 417 Ten Point Ln
- 116 Antler Hollow Ct
- 209 North Ct
- 1573 Haine School Rd
- 401 Sunny Dale Dr
- 300 Trafalgar Square
- 120 Dorsch Dr
- 210 Wyndmere Dr
- 115 Bellford Dr
- 109 Briarwood Ln
- 410 Anna Marie Dr
- 414 Anna Marie Dr
- 137 McDonald Dr
- Mendelssohn w/ Finished Basement Plan at Breckenridge
- Serenade w/ Finished Basement Plan at Breckenridge
- Schubert w/ Finished Basement Plan at Breckenridge
- 1156 Freedom Rd
- 585 Brandywine Dr
- 335 Laporte Ct
- 115 Leatherbark Rd