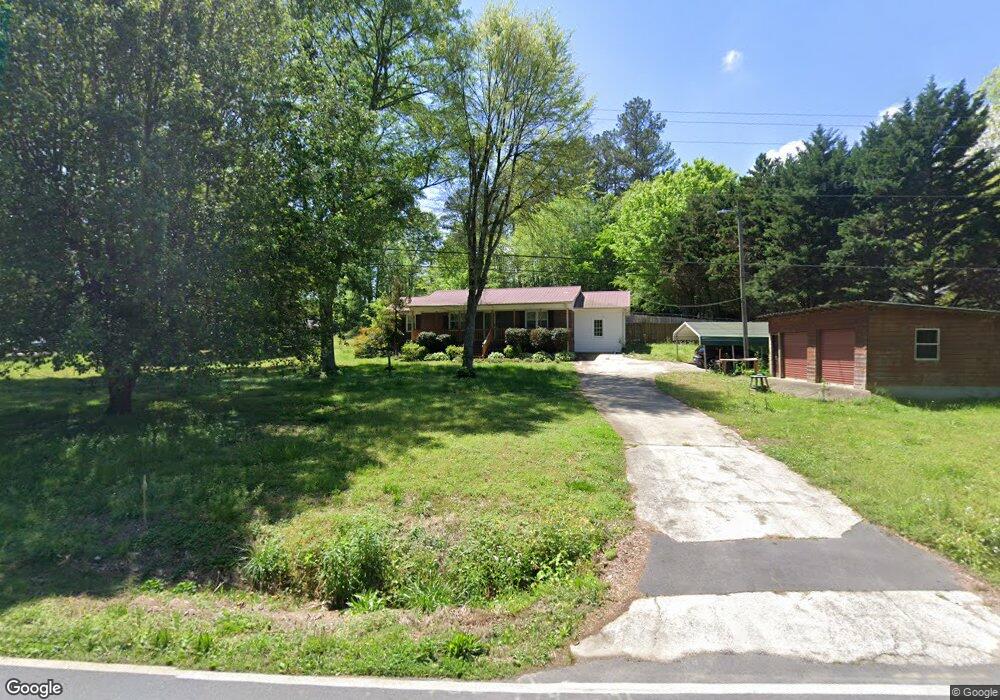
47 Bellview Rd Rockmart, GA 30153
Estimated Value: $199,000 - $227,000
3
Beds
1
Bath
1,350
Sq Ft
$161/Sq Ft
Est. Value
About This Home
This home is located at 47 Bellview Rd, Rockmart, GA 30153 and is currently estimated at $217,000, approximately $160 per square foot. 47 Bellview Rd is a home located in Polk County with nearby schools including Rockmart Middle School.
Ownership History
Date
Name
Owned For
Owner Type
Purchase Details
Closed on
Sep 22, 2022
Sold by
Obryan Bryan B
Bought by
Obryan Bryan B and Obryan Kathey
Current Estimated Value
Home Financials for this Owner
Home Financials are based on the most recent Mortgage that was taken out on this home.
Original Mortgage
$318,000
Outstanding Balance
$317,323
Interest Rate
5.78%
Mortgage Type
FHA
Estimated Equity
-$100,323
Purchase Details
Closed on
Mar 9, 1999
Sold by
O'Bryan Kathey Louise Lindsey Kato
Bought by
O'Bryan Bryan B
Purchase Details
Closed on
Jan 2, 1990
Sold by
Wallace John E
Bought by
Obrian Kathey Louise
Purchase Details
Closed on
Sep 16, 1981
Sold by
Kato Pell W
Bought by
Wallace John E
Purchase Details
Closed on
Nov 7, 1979
Bought by
Kato Pell W
Purchase Details
Closed on
Apr 13, 1973
Sold by
Haney B R
Bought by
Kato Pell W
Purchase Details
Closed on
Feb 18, 1967
Sold by
Longshore Thomas
Bought by
Haney B R
Purchase Details
Closed on
Oct 10, 1961
Bought by
Longshore Thomas
Create a Home Valuation Report for This Property
The Home Valuation Report is an in-depth analysis detailing your home's value as well as a comparison with similar homes in the area
Home Values in the Area
Average Home Value in this Area
Purchase History
| Date | Buyer | Sale Price | Title Company |
|---|---|---|---|
| Obryan Bryan B | -- | -- | |
| O'Bryan Bryan B | -- | -- | |
| Obrian Kathey Louise | -- | -- | |
| Wallace John E | -- | -- | |
| Kato Pell W | -- | -- | |
| Kato Pell W | -- | -- | |
| Haney B R | -- | -- | |
| Longshore Thomas | -- | -- |
Source: Public Records
Mortgage History
| Date | Status | Borrower | Loan Amount |
|---|---|---|---|
| Open | Obryan Bryan B | $318,000 | |
| Closed | Obryan Bryan B | $318,000 |
Source: Public Records
Tax History
| Year | Tax Paid | Tax Assessment Tax Assessment Total Assessment is a certain percentage of the fair market value that is determined by local assessors to be the total taxable value of land and additions on the property. | Land | Improvement |
|---|---|---|---|---|
| 2025 | $475 | $64,108 | $1,793 | $62,315 |
| 2024 | $475 | $54,712 | $1,681 | $53,031 |
| 2023 | $47 | $34,000 | $1,681 | $32,319 |
| 2022 | $353 | $28,256 | $1,121 | $27,135 |
| 2021 | $357 | $28,256 | $1,121 | $27,135 |
| 2020 | $358 | $28,256 | $1,121 | $27,135 |
| 2019 | $123 | $15,018 | $1,121 | $13,897 |
| 2018 | $121 | $14,554 | $1,121 | $13,433 |
| 2017 | $117 | $14,554 | $1,121 | $13,433 |
| 2016 | $119 | $14,773 | $1,340 | $13,433 |
| 2015 | $121 | $14,933 | $1,340 | $13,593 |
| 2014 | $122 | $14,933 | $1,340 | $13,593 |
Source: Public Records
Map
Nearby Homes
- 722 Prospect Rd
- 506 Prospect Rd
- 2300 Frettiesburg Dr
- 702 Calloway Dr
- 740 Calloway Dr
- 133 N Bellview Rd
- 100 Hixville Rd
- 19 Williams St
- 0 Rome Hwy 101 Unit 7513391
- 0 Rome Hwy 101 Unit 25352772
- 0 Rome Hwy 101 Unit 10445422
- 66 Elm St
- 58 Elm St
- 00 Nathan Dean Pkwy
- 2979 Nathan Dean Pkwy
- 14 Aragon Rd
- 0 Nathan Dean Pkwy Unit 10366146
- 0 Portland Rd Unit 10669909
- 0 Portland Rd Unit 7701690
- 98 Oakridge Dr
- 29 Bellview Rd
- 11 Bellview Rd
- 811 Prospect Rd
- 707 Prospect Rd
- 0 Bellview Rd
- 00 Bellview Rd
- 0 Bellview Rd Unit 7361867
- 0 Bellview Rd Unit 7312388
- 0 Bellview Rd Unit 7408608
- 0 Bellview Rd Unit 8486835
- 83 Bellview Rd
- 820 Prospect Rd
- 865 Prospect Rd
- 97 Bellview Rd
- 760 Prospect Rd
- 732 Prospect Rd
- 118 Bellview Rd
- 844 Prospect Rd
- 714 Prospect Rd
- 695 Prospect Rd