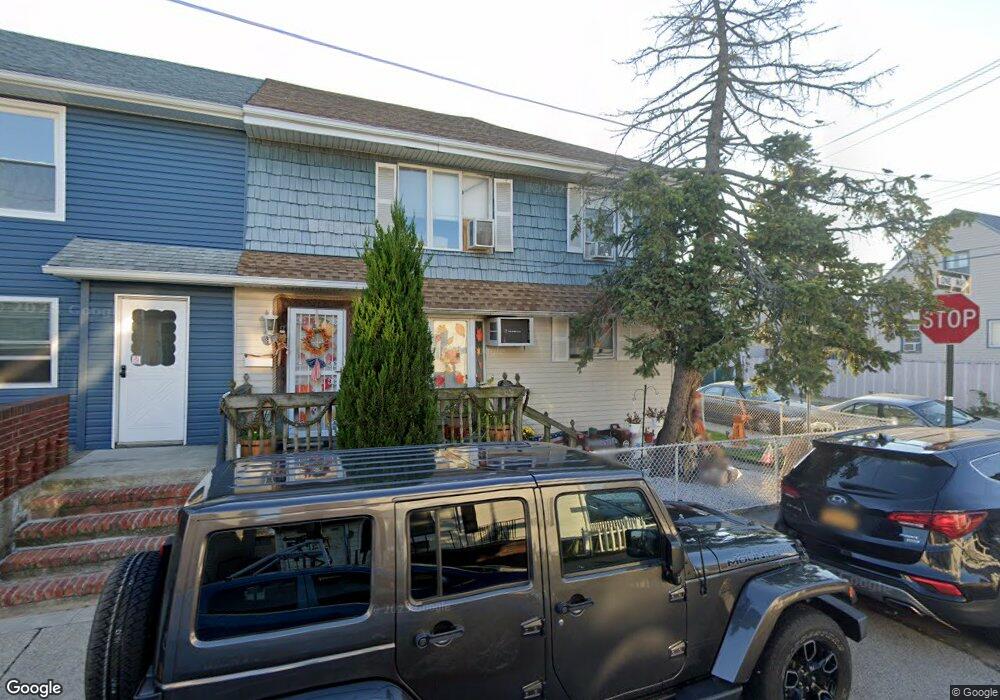
47 Bevy Ct Brooklyn, NY 11229
Gerritsen Beach NeighborhoodEstimated Value: $621,000 - $753,000
Studio
--
Bath
1,344
Sq Ft
$518/Sq Ft
Est. Value
About This Home
This home is located at 47 Bevy Ct, Brooklyn, NY 11229 and is currently estimated at $696,296, approximately $518 per square foot. 47 Bevy Ct is a home located in Kings County with nearby schools including P.S. 277 Gerritsen Beach, J.H.S. 278 Marine Park, and New Visions Charter High School for Advanced Math/ Science.
Ownership History
Date
Name
Owned For
Owner Type
Purchase Details
Closed on
Apr 8, 2021
Sold by
Martine Peter G
Bought by
Martine Maria Zappia and Martine Peter G
Current Estimated Value
Home Financials for this Owner
Home Financials are based on the most recent Mortgage that was taken out on this home.
Original Mortgage
$312,500
Outstanding Balance
$282,376
Interest Rate
3.05%
Mortgage Type
Purchase Money Mortgage
Estimated Equity
$413,921
Purchase Details
Closed on
Mar 15, 1996
Sold by
Eckelmann Charles
Bought by
Martine Peter G and Nelson Pauline G
Create a Home Valuation Report for This Property
The Home Valuation Report is an in-depth analysis detailing your home's value as well as a comparison with similar homes in the area
Home Values in the Area
Average Home Value in this Area
Purchase History
| Date | Buyer | Sale Price | Title Company |
|---|---|---|---|
| Martine Maria Zappia | -- | -- | |
| Martine Peter G | $156,500 | Commonwealth Land Title Ins |
Source: Public Records
Mortgage History
| Date | Status | Borrower | Loan Amount |
|---|---|---|---|
| Open | Martine Maria Zappia | $312,500 |
Source: Public Records
Tax History
| Year | Tax Paid | Tax Assessment Tax Assessment Total Assessment is a certain percentage of the fair market value that is determined by local assessors to be the total taxable value of land and additions on the property. | Land | Improvement |
|---|---|---|---|---|
| 2025 | $4,352 | $38,640 | $7,800 | $30,840 |
| 2024 | $4,352 | $34,920 | $7,800 | $27,120 |
| 2023 | $4,365 | $35,700 | $7,800 | $27,900 |
| 2022 | $4,025 | $30,300 | $7,800 | $22,500 |
| 2021 | $3,992 | $27,420 | $7,800 | $19,620 |
| 2020 | $932 | $25,680 | $7,800 | $17,880 |
| 2019 | $3,726 | $26,340 | $7,800 | $18,540 |
| 2018 | $3,591 | $19,078 | $4,218 | $14,860 |
| 2017 | $3,369 | $17,999 | $5,367 | $12,632 |
| 2016 | $3,085 | $16,981 | $6,132 | $10,849 |
| 2015 | $2,430 | $16,020 | $6,480 | $9,540 |
| 2014 | $2,430 | $16,020 | $6,480 | $9,540 |
Source: Public Records
Map
Nearby Homes
Your Personal Tour Guide
Ask me questions while you tour the home.