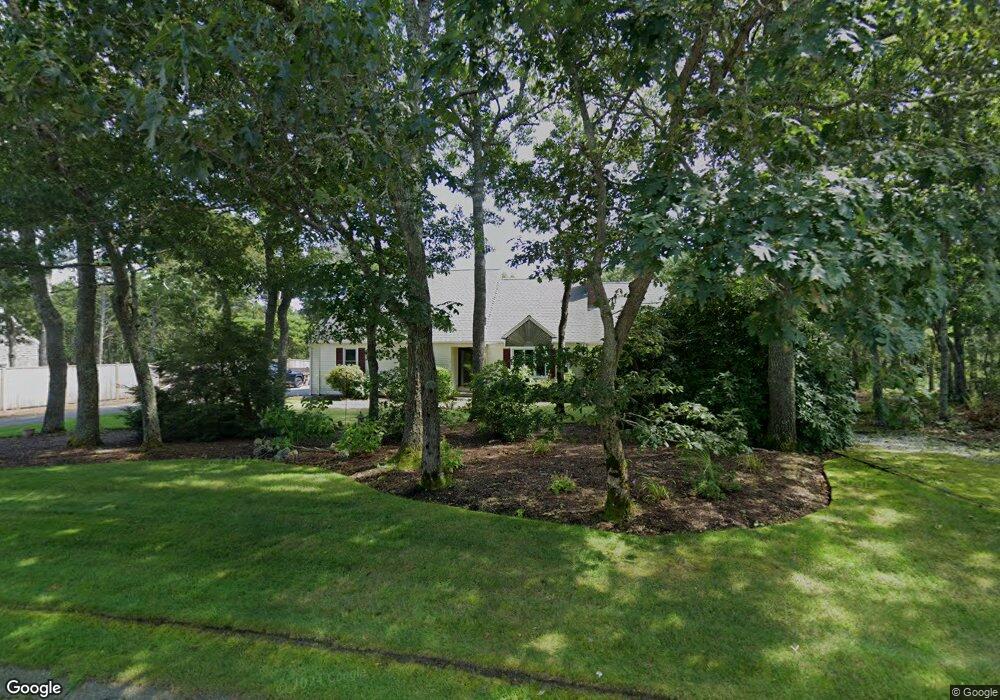
47 Blueberry Ln Harwich, MA 02645
Northwest Harwich NeighborhoodEstimated Value: $685,000 - $865,000
3
Beds
2
Baths
1,501
Sq Ft
$521/Sq Ft
Est. Value
About This Home
This home is located at 47 Blueberry Ln, Harwich, MA 02645 and is currently estimated at $781,886, approximately $520 per square foot. 47 Blueberry Ln is a home located in Barnstable County with nearby schools including Harwich Elementary School, Chatham Elementary School, and Monomoy Regional Middle School.
Ownership History
Date
Name
Owned For
Owner Type
Purchase Details
Closed on
Sep 19, 2023
Sold by
Bodell Samuel P and Bodell Dara C
Bought by
Compass Rose Rt and Bodell
Current Estimated Value
Purchase Details
Closed on
Jan 12, 2021
Sold by
Bodell Samuel P
Bought by
Bodell Samuel P and Bodell Dara C
Purchase Details
Closed on
Jun 14, 2002
Sold by
Vogel Thomas A and Vogel Arlene M
Bought by
Bodell Samuel P and Murray Joan M
Home Financials for this Owner
Home Financials are based on the most recent Mortgage that was taken out on this home.
Original Mortgage
$100,000
Interest Rate
6.8%
Mortgage Type
Purchase Money Mortgage
Purchase Details
Closed on
Oct 24, 1996
Sold by
Hanley Linda F
Bought by
Vogel Thomas A and Vogel Arlene M
Purchase Details
Closed on
Jun 30, 1995
Sold by
Modern Continental Ent
Bought by
Hanley Linda F
Home Financials for this Owner
Home Financials are based on the most recent Mortgage that was taken out on this home.
Original Mortgage
$85,000
Interest Rate
7.8%
Mortgage Type
Purchase Money Mortgage
Create a Home Valuation Report for This Property
The Home Valuation Report is an in-depth analysis detailing your home's value as well as a comparison with similar homes in the area
Home Values in the Area
Average Home Value in this Area
Purchase History
| Date | Buyer | Sale Price | Title Company |
|---|---|---|---|
| Compass Rose Rt | -- | None Available | |
| Bodell Samuel P | -- | None Available | |
| Bodell Samuel P | $355,000 | -- | |
| Vogel Thomas A | $173,000 | -- | |
| Hanley Linda F | $172,750 | -- |
Source: Public Records
Mortgage History
| Date | Status | Borrower | Loan Amount |
|---|---|---|---|
| Previous Owner | Hanley Linda F | $102,800 | |
| Previous Owner | Hanley Linda F | $100,000 | |
| Previous Owner | Hanley Linda F | $85,000 |
Source: Public Records
Tax History Compared to Growth
Tax History
| Year | Tax Paid | Tax Assessment Tax Assessment Total Assessment is a certain percentage of the fair market value that is determined by local assessors to be the total taxable value of land and additions on the property. | Land | Improvement |
|---|---|---|---|---|
| 2025 | $4,358 | $737,400 | $261,300 | $476,100 |
| 2024 | $4,228 | $701,200 | $246,500 | $454,700 |
| 2023 | $4,051 | $610,100 | $224,100 | $386,000 |
| 2022 | $3,962 | $488,500 | $194,900 | $293,600 |
| 2021 | $3,827 | $445,000 | $177,200 | $267,800 |
| 2020 | $3,786 | $433,700 | $173,500 | $260,200 |
| 2019 | $3,547 | $409,100 | $166,700 | $242,400 |
| 2018 | $3,610 | $398,300 | $151,600 | $246,700 |
| 2017 | $3,309 | $368,900 | $138,100 | $230,800 |
| 2016 | $3,254 | $358,800 | $138,100 | $220,700 |
| 2015 | $3,027 | $337,500 | $123,100 | $214,400 |
| 2014 | $2,894 | $330,000 | $119,400 | $210,600 |
Source: Public Records
Map
Nearby Homes
- 53 Blueberry Ln
- 41 Blueberry Ln
- 42 Blueberry Ln
- 59 Blueberry Ln
- 31 Blueberry Ln
- 56 Blueberry Ln
- 34 Blueberry Ln
- 29 Blueberry Ln
- 29 Bittersweet Ln
- 69 Blueberry Ln
- 30 Blueberry Ln
- 0 Blueberry Ln
- 25 Blueberry Ln
- 27 Bittersweet Ln
- 62 Blueberry Ln
- 28 Bittersweet Ln
- 26 Blueberry Ln
- 21 Blueberry Ln
- 70 Blueberry Ln
- 23 Bittersweet Ln