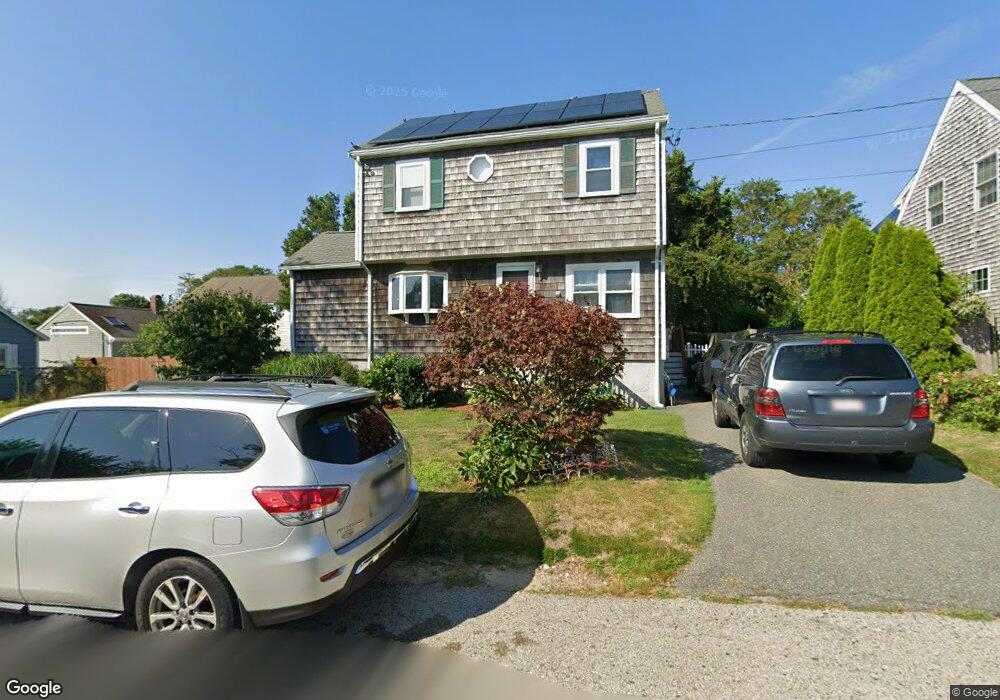
47 Bradley St Marshfield, MA 02050
Ocean Bluff-Brant Rock NeighborhoodEstimated Value: $679,000 - $776,000
4
Beds
2
Baths
1,560
Sq Ft
$468/Sq Ft
Est. Value
About This Home
This home is located at 47 Bradley St, Marshfield, MA 02050 and is currently estimated at $729,406, approximately $467 per square foot. 47 Bradley St is a home located in Plymouth County with nearby schools including Governor Edward Winslow School, Furnace Brook Middle School, and Marshfield High School.
Ownership History
Date
Name
Owned For
Owner Type
Purchase Details
Closed on
Aug 20, 2004
Sold by
Ribadeneyra Timothy and Ribadeneyra Edythe M
Bought by
Fahey John and Fahey Olga M
Current Estimated Value
Purchase Details
Closed on
Jun 10, 1998
Sold by
Cadigan Jill and Christenson Donald T
Bought by
Ribadeneyra Timothy and Ribadeneyra Edythe M
Purchase Details
Closed on
Dec 28, 1993
Sold by
Metcalf Stephen and Metcalf Michelle K
Bought by
Cadigan Jill
Create a Home Valuation Report for This Property
The Home Valuation Report is an in-depth analysis detailing your home's value as well as a comparison with similar homes in the area
Home Values in the Area
Average Home Value in this Area
Purchase History
We collect this data history from publicly available records. To have your information removed, we recommend requesting removal directly through your county’s website.
| Date | Buyer | Sale Price | Title Company |
|---|---|---|---|
| Fahey John | $363,700 | -- | |
| Fahey John P | $363,700 | -- | |
| Ribadeneyra Timothy | $159,900 | -- | |
| Ribadeneyra Timothy J | $159,900 | -- | |
| Cadigan Jill | $108,800 | -- | |
| Cadigan Jill A R | $108,800 | -- |
Source: Public Records
Mortgage History
We collect this data history from publicly available records. To have your information removed, we recommend requesting removal directly through your county’s website.
| Date | Status | Borrower | Loan Amount |
|---|---|---|---|
| Open | Cadigan Jill A R | $288,150 |
Source: Public Records
Tax History
| Year | Tax Paid | Tax Assessment Tax Assessment Total Assessment is a certain percentage of the fair market value that is determined by local assessors to be the total taxable value of land and additions on the property. | Land | Improvement |
|---|---|---|---|---|
| 2025 | $6,218 | $628,100 | $318,600 | $309,500 |
| 2024 | $6,028 | $580,200 | $298,600 | $281,600 |
| 2023 | $5,636 | $512,800 | $268,800 | $244,000 |
| 2022 | $5,636 | $435,200 | $229,000 | $206,200 |
| 2021 | $5,330 | $404,100 | $219,000 | $185,100 |
| 2020 | $4,917 | $368,900 | $189,100 | $179,800 |
| 2019 | $4,794 | $358,300 | $189,100 | $169,200 |
| 2018 | $4,744 | $354,800 | $189,100 | $165,700 |
| 2017 | $4,447 | $324,100 | $179,200 | $144,900 |
| 2016 | $4,203 | $302,800 | $169,200 | $133,600 |
| 2015 | $3,974 | $299,000 | $169,200 | $129,800 |
| 2014 | $3,883 | $292,200 | $169,200 | $123,000 |
Source: Public Records
Map
Nearby Homes
- 71 Webster Ave
- 36 Ocean St
- 64 Central St
- 8 Water St
- 245 Careswell St
- 1028 Ocean St
- 120 Monitor Rd
- 1221 Ocean St
- 54 Longview Terrace
- 91 Winslow St
- 585 Careswell St
- 19 Copeland St
- 264 Webster St
- 14 Ivy St
- 108 Observatory Waye
- 40 Signal Hill Rd
- 36 Ocean Rd N
- 155 Quincy Ave
- 46 Fairways Edge Dr
- 134 Wellington Ave
Your Personal Tour Guide
Ask me questions while you tour the home.