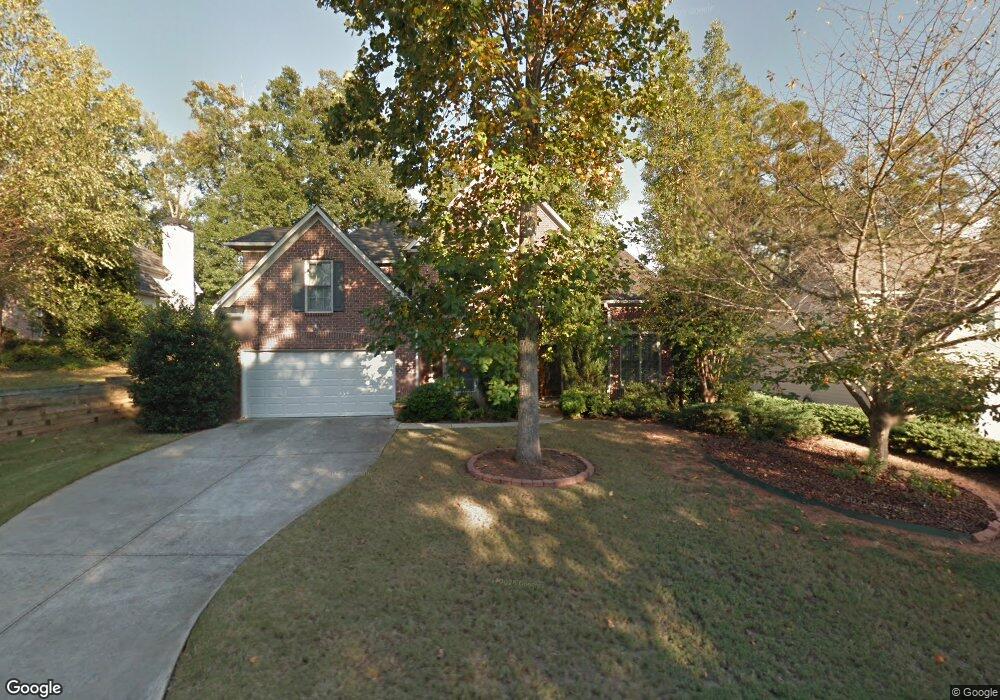
47 Briar Grove Newnan, GA 30265
Summergrove NeighborhoodEstimated Value: $454,350 - $556,000
3
Beds
3
Baths
3,167
Sq Ft
$164/Sq Ft
Est. Value
About This Home
This home is located at 47 Briar Grove, Newnan, GA 30265 and is currently estimated at $520,338, approximately $164 per square foot. 47 Briar Grove is a home located in Coweta County with nearby schools including Welch Elementary School, Lee Middle School, and East Coweta High School.
Ownership History
Date
Name
Owned For
Owner Type
Purchase Details
Closed on
Mar 1, 2021
Sold by
Carter James M
Bought by
Carter Dejanea T
Current Estimated Value
Home Financials for this Owner
Home Financials are based on the most recent Mortgage that was taken out on this home.
Original Mortgage
$174,600
Outstanding Balance
$156,517
Interest Rate
2.7%
Mortgage Type
New Conventional
Estimated Equity
$363,821
Purchase Details
Closed on
Dec 18, 2000
Sold by
Centex Homes
Bought by
Carter James M and Carter Olive F
Home Financials for this Owner
Home Financials are based on the most recent Mortgage that was taken out on this home.
Original Mortgage
$133,000
Interest Rate
7.81%
Mortgage Type
New Conventional
Purchase Details
Closed on
Sep 17, 1999
Sold by
Peachtree City Holdi
Bought by
Centex Homes Inc
Purchase Details
Closed on
Jun 12, 1997
Sold by
Jefferson Ventures I
Bought by
Peachtree City Holdi
Purchase Details
Closed on
Jun 30, 1984
Bought by
Jefferson Ventures I
Create a Home Valuation Report for This Property
The Home Valuation Report is an in-depth analysis detailing your home's value as well as a comparison with similar homes in the area
Home Values in the Area
Average Home Value in this Area
Purchase History
| Date | Buyer | Sale Price | Title Company |
|---|---|---|---|
| Carter Dejanea T | $180,000 | -- | |
| Carter James M | $266,200 | -- | |
| Centex Homes Inc | $800,200 | -- | |
| Peachtree City Holdi | $2,828,900 | -- | |
| Jefferson Ventures I | -- | -- |
Source: Public Records
Mortgage History
| Date | Status | Borrower | Loan Amount |
|---|---|---|---|
| Open | Carter Dejanea T | $174,600 | |
| Previous Owner | Carter James M | $133,000 |
Source: Public Records
Tax History Compared to Growth
Tax History
| Year | Tax Paid | Tax Assessment Tax Assessment Total Assessment is a certain percentage of the fair market value that is determined by local assessors to be the total taxable value of land and additions on the property. | Land | Improvement |
|---|---|---|---|---|
| 2024 | $4,414 | $196,592 | $40,000 | $156,592 |
| 2023 | $4,414 | $192,752 | $32,000 | $160,752 |
| 2022 | $3,981 | $167,116 | $32,000 | $135,116 |
| 2021 | $1,594 | $134,930 | $26,000 | $108,930 |
| 2020 | $1,653 | $134,930 | $26,000 | $108,930 |
| 2019 | $2,230 | $126,238 | $18,000 | $108,238 |
| 2018 | $2,251 | $126,238 | $18,000 | $108,238 |
| 2017 | $1,799 | $111,749 | $18,000 | $93,749 |
| 2016 | $1,752 | $110,044 | $18,000 | $92,044 |
| 2015 | $1,752 | $110,044 | $18,000 | $92,044 |
| 2014 | $1,612 | $96,408 | $18,000 | $78,408 |
Source: Public Records
Map
Nearby Homes
- 41 Briar Grove
- 3 Briar Grove
- 39 Rollingbrook Vista
- 30 Oak Shores Dr
- 145 Pine Crescent
- 15 Oak Shores Dr
- 425 Lake Forest Dr
- 59 Gables Way
- 43 Beacon Crest
- 113 Portico Place
- 55 Tillinghast Trace
- 49 High Point Cir
- 905 White Oak Dr
- 5 Corbel Way
- 3 Corbel Way
- 197 Portico Place
- 45 Greens Ct
- 85 Greens Ct
- 173 Freeman Forest Dr
- 6 Scenic Hills Dr
- 53 Briar Grove
- 31 Briar Grove
- 27 Oak Park Square
- 27 Oak Park Square
- 31 Briar Grove
- 33 Oak Park Square
- 57 Briar Grove
- 39 Oak Park Square
- 48 Briar Grove
- 42 Briar Grove
- 56 Briar Grove
- 17 Oak Park Square
- 27 Briar Grove
- 34 Briar Grove
- 43 Oak Park Square
- 43 Oak Park Square Unit 37
- 63 Briar Grove
- 22 Briar Grove
- 49 Oak Park Square
- 62 Briar Grove