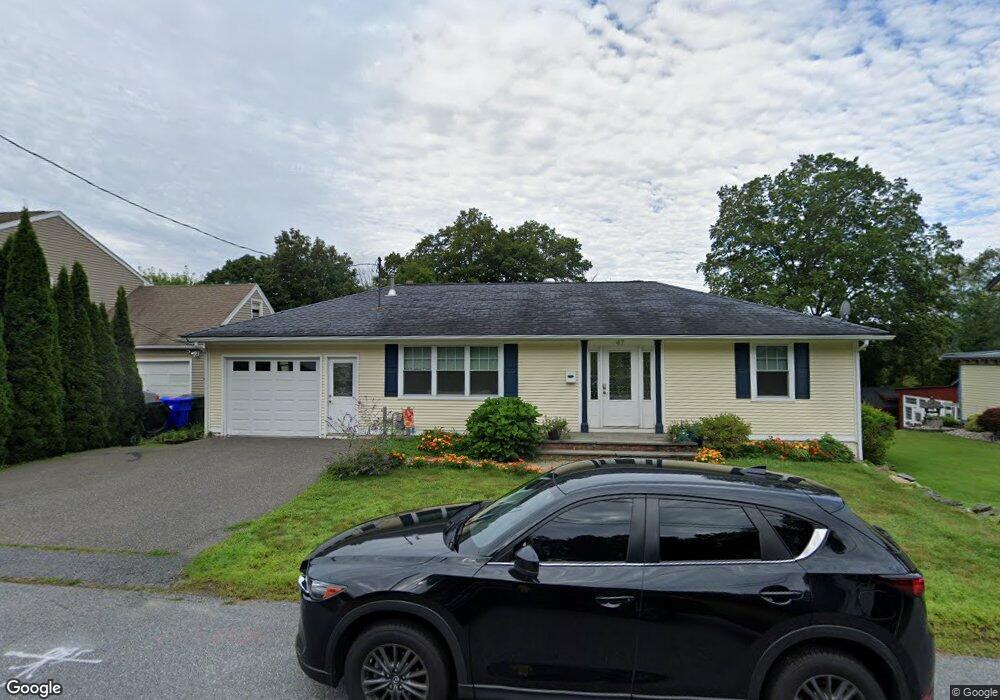
47 Bristol St Thomaston, CT 06787
Estimated Value: $326,000 - $358,000
2
Beds
2
Baths
1,840
Sq Ft
$187/Sq Ft
Est. Value
About This Home
This home is located at 47 Bristol St, Thomaston, CT 06787 and is currently estimated at $343,970, approximately $186 per square foot. 47 Bristol St is a home located in Litchfield County with nearby schools including Black Rock School, Thomaston Center School, and Thomaston High School.
Ownership History
Date
Name
Owned For
Owner Type
Purchase Details
Closed on
Feb 25, 2013
Sold by
Laviana Marie
Bought by
Genest Myriah and Genest Daniel
Current Estimated Value
Home Financials for this Owner
Home Financials are based on the most recent Mortgage that was taken out on this home.
Original Mortgage
$152,625
Outstanding Balance
$106,277
Interest Rate
3.25%
Mortgage Type
FHA
Estimated Equity
$237,693
Purchase Details
Closed on
Jan 30, 1995
Sold by
Maturo John and Maturo Karen
Bought by
Rieley John and Rieley Tammy
Home Financials for this Owner
Home Financials are based on the most recent Mortgage that was taken out on this home.
Original Mortgage
$101,850
Interest Rate
9.24%
Mortgage Type
Unknown
Create a Home Valuation Report for This Property
The Home Valuation Report is an in-depth analysis detailing your home's value as well as a comparison with similar homes in the area
Home Values in the Area
Average Home Value in this Area
Purchase History
| Date | Buyer | Sale Price | Title Company |
|---|---|---|---|
| Genest Myriah | -- | -- | |
| Rieley John | $99,900 | -- |
Source: Public Records
Mortgage History
| Date | Status | Borrower | Loan Amount |
|---|---|---|---|
| Open | Rieley John | $152,625 | |
| Previous Owner | Rieley John | $105,000 | |
| Previous Owner | Rieley John | $101,850 |
Source: Public Records
Tax History Compared to Growth
Tax History
| Year | Tax Paid | Tax Assessment Tax Assessment Total Assessment is a certain percentage of the fair market value that is determined by local assessors to be the total taxable value of land and additions on the property. | Land | Improvement |
|---|---|---|---|---|
| 2025 | $5,186 | $144,830 | $43,610 | $101,220 |
| 2024 | $4,976 | $144,830 | $43,610 | $101,220 |
| 2023 | $4,871 | $144,830 | $43,610 | $101,220 |
| 2022 | $4,650 | $144,830 | $43,610 | $101,220 |
| 2021 | $4,590 | $127,050 | $43,610 | $83,440 |
| 2020 | $4,590 | $127,050 | $43,610 | $83,440 |
| 2019 | $4,641 | $127,050 | $43,610 | $83,440 |
| 2018 | $4,547 | $127,050 | $43,610 | $83,440 |
| 2017 | $4,453 | $127,050 | $43,610 | $83,440 |
| 2016 | $4,608 | $135,240 | $41,580 | $93,660 |
| 2015 | $4,548 | $135,240 | $41,580 | $93,660 |
| 2014 | $4,548 | $135,240 | $41,580 | $93,660 |
Source: Public Records
Map
Nearby Homes
- 461 E Main St
- 785 Main St
- 162 Bristol St
- 684 Main St
- 104 Judson St
- 56 Hillside Ave
- 7 South St
- 16 Tracy St
- 22 Park St
- 211 Pine Hill Blvd Unit 211
- 96 Elm St
- 71 Treadwell Ave
- 214 Pine Hill Blvd Unit 214
- 17 George St
- 49 Center St
- 120 Hotchkiss Ave
- 42 Litchfield St
- 119 Humiston Cir
- 362 Hill Rd
- 174 Litchfield St