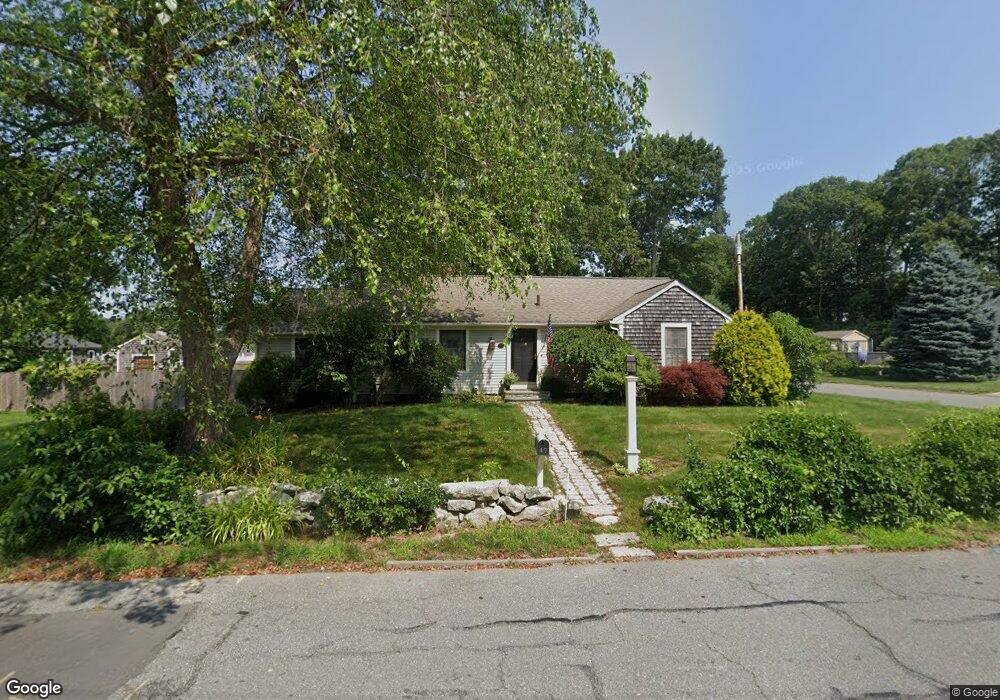
47 Bryant St North Dartmouth, MA 02747
North Dartmouth NeighborhoodEstimated Value: $497,548 - $538,000
3
Beds
2
Baths
1,607
Sq Ft
$324/Sq Ft
Est. Value
About This Home
This home is located at 47 Bryant St, North Dartmouth, MA 02747 and is currently estimated at $519,887, approximately $323 per square foot. 47 Bryant St is a home located in Bristol County with nearby schools including Dartmouth High School, Nazarene Christian Academy, and Our Sister's School.
Ownership History
Date
Name
Owned For
Owner Type
Purchase Details
Closed on
Jun 1, 2022
Sold by
Arruda John C and Arruda Katherine M
Bought by
Arruda Christopher
Current Estimated Value
Purchase Details
Closed on
Jun 23, 1978
Bought by
Arruda John C and Arruda Katherine M
Create a Home Valuation Report for This Property
The Home Valuation Report is an in-depth analysis detailing your home's value as well as a comparison with similar homes in the area
Home Values in the Area
Average Home Value in this Area
Purchase History
| Date | Buyer | Sale Price | Title Company |
|---|---|---|---|
| Arruda Christopher | -- | None Available | |
| Arruda John C | -- | -- |
Source: Public Records
Mortgage History
| Date | Status | Borrower | Loan Amount |
|---|---|---|---|
| Previous Owner | Arruda John C | $136,000 | |
| Previous Owner | Arruda John C | $126,000 |
Source: Public Records
Tax History Compared to Growth
Tax History
| Year | Tax Paid | Tax Assessment Tax Assessment Total Assessment is a certain percentage of the fair market value that is determined by local assessors to be the total taxable value of land and additions on the property. | Land | Improvement |
|---|---|---|---|---|
| 2025 | $3,652 | $403,500 | $166,700 | $236,800 |
| 2024 | $3,505 | $383,500 | $159,100 | $224,400 |
| 2023 | $3,397 | $350,600 | $147,500 | $203,100 |
| 2022 | $3,221 | $310,900 | $141,100 | $169,800 |
| 2021 | $3,155 | $291,300 | $124,500 | $166,800 |
| 2020 | $3,090 | $284,000 | $124,500 | $159,500 |
| 2019 | $3,061 | $282,100 | $124,500 | $157,600 |
| 2018 | $2,807 | $264,500 | $124,500 | $140,000 |
| 2017 | $2,696 | $253,400 | $117,500 | $135,900 |
| 2016 | $2,593 | $245,100 | $117,500 | $127,600 |
| 2015 | $2,512 | $239,000 | $109,800 | $129,200 |
| 2014 | $2,359 | $226,000 | $99,500 | $126,500 |
Source: Public Records
Map
Nearby Homes
- 3 Spring Hill Rd
- 1 Spring Hill Rd
- 818 Hathaway Rd
- 50 Lyng St
- 0 Middlesex St
- 805 Hathaway Rd Unit 809
- 6 Kingston St
- 0 Norfolk Ave Unit 73403282
- 51 Ryder St
- 148 Nellie Rd
- 1406 Tucker Rd
- 317 Commonwealth Ave
- 1249-1251 Rockdale Ave
- 129 Rowe St
- 13 Old Westport Rd
- 160 Hapwell St
- 46 Old Westport Rd
- ) Hapwell & Summit St
- 0 Undisclosed Unit 73376281
- 6 Strathmore Rd