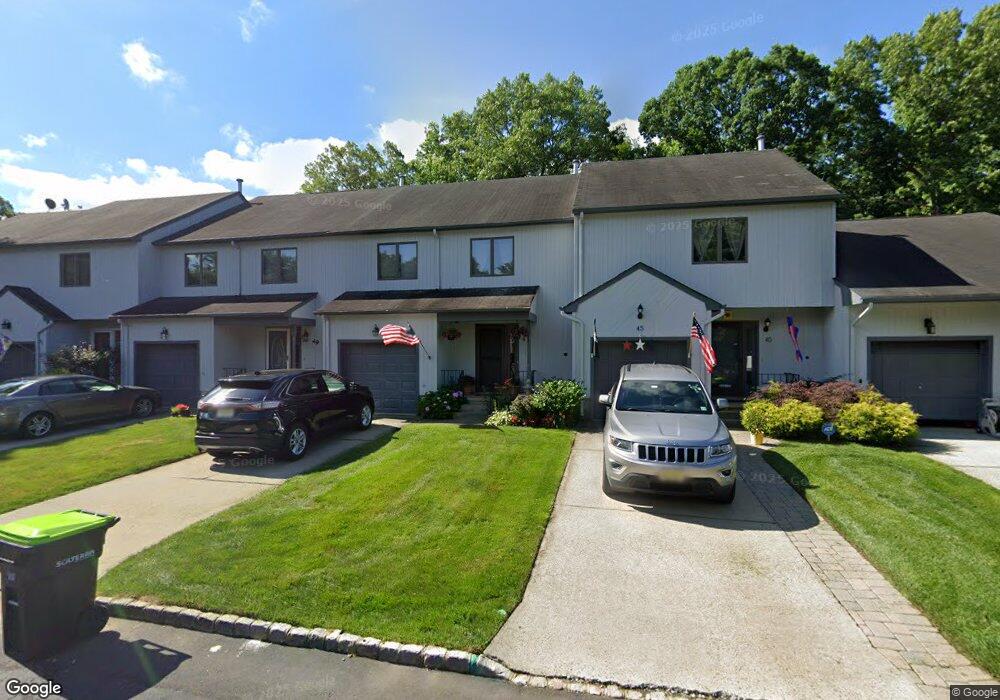
47 Carmel Ct Old Bridge, NJ 08857
Estimated Value: $567,977 - $618,000
3
Beds
3
Baths
1,958
Sq Ft
$303/Sq Ft
Est. Value
About This Home
This home is located at 47 Carmel Ct, Old Bridge, NJ 08857 and is currently estimated at $592,494, approximately $302 per square foot. 47 Carmel Ct is a home located in Middlesex County with nearby schools including Old Bridge High School, St. Thomas the Apostle School, and St. Ambrose School.
Ownership History
Date
Name
Owned For
Owner Type
Purchase Details
Closed on
Aug 12, 2025
Sold by
Bombardier Martha and Bombardier John
Bought by
Bombardier John
Current Estimated Value
Purchase Details
Closed on
Oct 21, 2011
Sold by
Dunckley Sean and Dunckley Lauren
Bought by
Bombardier Dennis W and Bombardier Martha
Purchase Details
Closed on
Sep 19, 2005
Sold by
Demaio Elizabeth
Bought by
Dunckley Sean and Dunckley Lauren
Home Financials for this Owner
Home Financials are based on the most recent Mortgage that was taken out on this home.
Original Mortgage
$277,600
Interest Rate
5.79%
Create a Home Valuation Report for This Property
The Home Valuation Report is an in-depth analysis detailing your home's value as well as a comparison with similar homes in the area
Home Values in the Area
Average Home Value in this Area
Purchase History
| Date | Buyer | Sale Price | Title Company |
|---|---|---|---|
| Bombardier John | -- | None Listed On Document | |
| Bombardier Dennis W | $285,000 | Quality Title & Abstract Age | |
| Dunckley Sean | $347,000 | -- |
Source: Public Records
Mortgage History
| Date | Status | Borrower | Loan Amount |
|---|---|---|---|
| Previous Owner | Dunckley Sean | $277,600 |
Source: Public Records
Tax History Compared to Growth
Tax History
| Year | Tax Paid | Tax Assessment Tax Assessment Total Assessment is a certain percentage of the fair market value that is determined by local assessors to be the total taxable value of land and additions on the property. | Land | Improvement |
|---|---|---|---|---|
| 2025 | $7,341 | $130,000 | $34,000 | $96,000 |
| 2024 | $7,042 | $130,000 | $34,000 | $96,000 |
| 2023 | $7,042 | $130,000 | $34,000 | $96,000 |
| 2022 | $6,881 | $130,000 | $34,000 | $96,000 |
| 2021 | $4,990 | $130,000 | $34,000 | $96,000 |
| 2020 | $6,678 | $130,000 | $34,000 | $96,000 |
| 2019 | $6,565 | $130,000 | $34,000 | $96,000 |
| 2018 | $6,492 | $130,000 | $34,000 | $96,000 |
| 2017 | $6,282 | $130,000 | $34,000 | $96,000 |
| 2016 | $6,152 | $130,000 | $34,000 | $96,000 |
| 2015 | $6,045 | $130,000 | $34,000 | $96,000 |
| 2014 | $5,984 | $130,000 | $34,000 | $96,000 |
Source: Public Records
Map
Nearby Homes