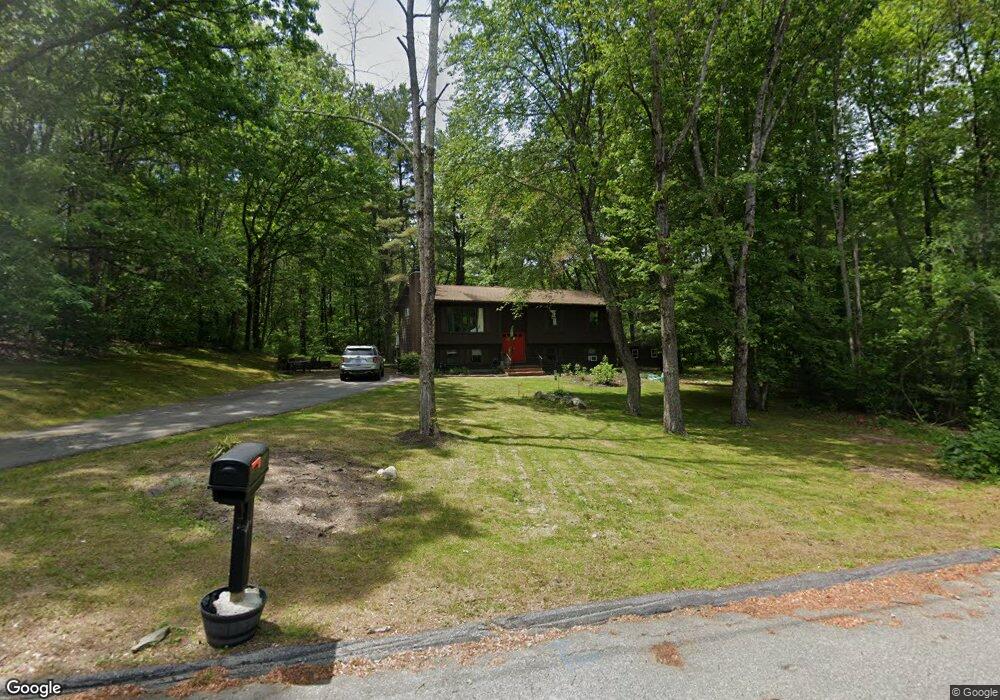
47 Cedar Forest Rd Smithfield, RI 02917
Estimated Value: $552,338 - $651,000
4
Beds
2
Baths
2,200
Sq Ft
$281/Sq Ft
Est. Value
About This Home
This home is located at 47 Cedar Forest Rd, Smithfield, RI 02917 and is currently estimated at $619,085, approximately $281 per square foot. 47 Cedar Forest Rd is a home located in Providence County with nearby schools including Raymond Laperche School, Vincent J. Gallagher Middle School, and Smithfield High School.
Ownership History
Date
Name
Owned For
Owner Type
Purchase Details
Closed on
Feb 27, 2020
Sold by
Payne Legein and Payne Natacha
Bought by
Adagboyi Anthony A
Current Estimated Value
Home Financials for this Owner
Home Financials are based on the most recent Mortgage that was taken out on this home.
Original Mortgage
$333,841
Outstanding Balance
$301,591
Interest Rate
4.62%
Mortgage Type
FHA
Estimated Equity
$317,494
Purchase Details
Closed on
Apr 28, 2011
Sold by
Fraziano Anthony E
Bought by
Dream House Mtg Corp
Purchase Details
Closed on
Apr 7, 2006
Sold by
Des Properties
Bought by
Graziano Anthony
Purchase Details
Closed on
Dec 31, 2001
Sold by
Brussard Richard J
Bought by
Des Prop Llc
Create a Home Valuation Report for This Property
The Home Valuation Report is an in-depth analysis detailing your home's value as well as a comparison with similar homes in the area
Home Values in the Area
Average Home Value in this Area
Purchase History
| Date | Buyer | Sale Price | Title Company |
|---|---|---|---|
| Adagboyi Anthony A | $340,000 | None Available | |
| Dream House Mtg Corp | $382,500 | -- | |
| Graziano Anthony | $322,000 | -- | |
| Des Prop Llc | $235,000 | -- |
Source: Public Records
Mortgage History
| Date | Status | Borrower | Loan Amount |
|---|---|---|---|
| Open | Adagboyi Anthony A | $333,841 | |
| Previous Owner | Des Prop Llc | $382,500 | |
| Previous Owner | Des Prop Llc | $91,807 |
Source: Public Records
Tax History
| Year | Tax Paid | Tax Assessment Tax Assessment Total Assessment is a certain percentage of the fair market value that is determined by local assessors to be the total taxable value of land and additions on the property. | Land | Improvement |
|---|---|---|---|---|
| 2025 | $5,644 | $455,500 | $178,400 | $277,100 |
| 2024 | $5,363 | $371,400 | $149,500 | $221,900 |
| 2023 | $5,096 | $371,400 | $149,500 | $221,900 |
| 2022 | $4,962 | $371,400 | $149,500 | $221,900 |
| 2021 | $4,574 | $267,000 | $109,500 | $157,500 |
| 2020 | $4,488 | $267,000 | $109,500 | $157,500 |
| 2019 | $4,488 | $267,000 | $109,500 | $157,500 |
| 2018 | $4,689 | $267,000 | $125,100 | $141,900 |
| 2017 | $4,689 | $267,000 | $125,100 | $141,900 |
| 2016 | $4,403 | $263,200 | $121,300 | $141,900 |
| 2015 | $4,312 | $245,400 | $111,100 | $134,300 |
| 2012 | $4,369 | $272,700 | $132,900 | $139,800 |
Source: Public Records
Map
Nearby Homes
- 450 Log Rd
- 1283 Douglas Pike
- 17 Rogler Farm Rd
- 113 Log Rd
- 0 Douglas Pike
- 540 Greenville Rd
- 0 Christina Way Unit 1360886
- 1537 Providence Pike
- 87 Mann School Rd
- 0 Follett St Unit 1394978
- 230 George Washington Hwy
- 0 Taber Hill Rd Unit 1396868
- 1 Hanton City Trail
- 1 Capron Rd
- 100 Swan Rd
- 608 Black Plain Rd
- 5 Kristen Dr
- 20 Macarthur Dr
- 189 Pleasant View Ave
- 80 Swan Rd
- 49 Cedar Forest Rd
- 48 Cedar Forest Rd
- 50 Cedar Forest Rd
- 57 Latham Farm Rd
- 161 Cedar Forest Rd
- 52 Cedar Forest Rd
- 55 Latham Farm Rd
- 53 Latham Farm Rd
- 42 Latham Farm Rd
- 75 Cedar Forest Rd
- 74 Cedar Forest Rd
- 51 Latham Farm Rd
- 0 Cedar Forest Rd Unit 1258064
- 0 Cedar Forest Rd Unit 1301715
- 0 Cedar Forest Rd Unit 1310319
- 0 Cedar Forest Rd Unit 1308853
- 81 Cedar Forest Rd
- 40 Latham Farm Rd
- 80 Cedar Forest Rd
- 43 Latham Farm Rd
Your Personal Tour Guide
Ask me questions while you tour the home.