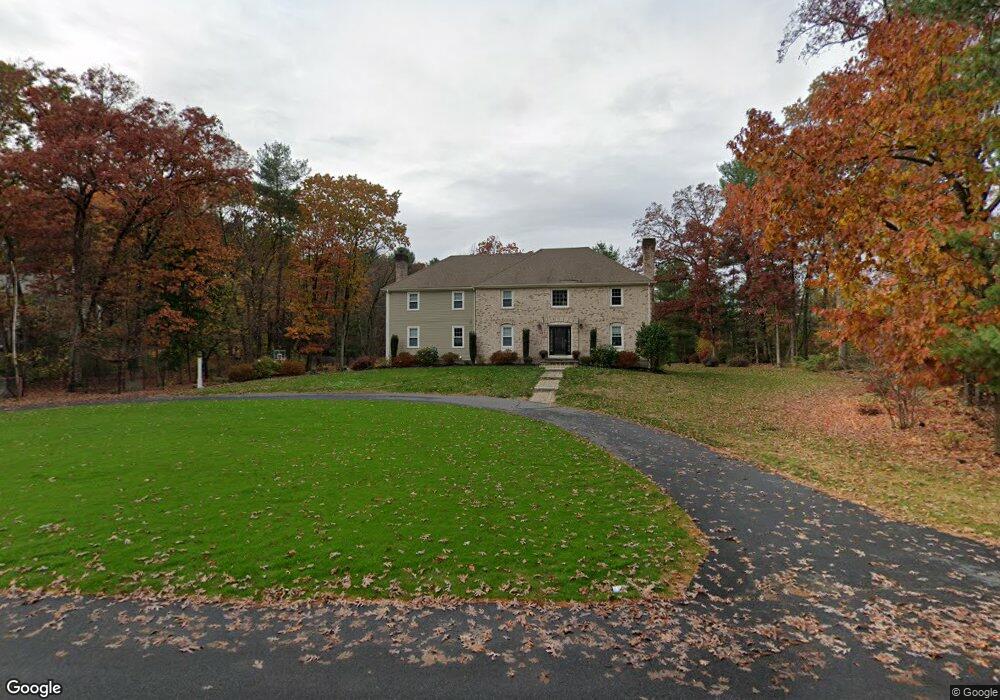
47 Chanticleer Rd Sudbury, MA 01776
Estimated Value: $1,422,537 - $1,687,000
5
Beds
3
Baths
3,404
Sq Ft
$459/Sq Ft
Est. Value
About This Home
This home is located at 47 Chanticleer Rd, Sudbury, MA 01776 and is currently estimated at $1,562,384, approximately $458 per square foot. 47 Chanticleer Rd is a home located in Middlesex County with nearby schools including Josiah Haynes Elementary School, Ephraim Curtis Middle School, and Lincoln-Sudbury Regional High School.
Ownership History
Date
Name
Owned For
Owner Type
Purchase Details
Closed on
Jun 23, 2010
Sold by
Cordaro Marc A and Zelamsky Leslie B
Bought by
Martin Chad and Martin Bobbi
Current Estimated Value
Home Financials for this Owner
Home Financials are based on the most recent Mortgage that was taken out on this home.
Original Mortgage
$628,000
Outstanding Balance
$421,094
Interest Rate
4.98%
Mortgage Type
Purchase Money Mortgage
Estimated Equity
$1,141,290
Purchase Details
Closed on
Jul 15, 2004
Sold by
Chanticleer Rd Rt and Shanzer Harriet E
Bought by
Zelamsky Leslie B and Cordaro Marc A
Home Financials for this Owner
Home Financials are based on the most recent Mortgage that was taken out on this home.
Original Mortgage
$630,000
Interest Rate
6.25%
Mortgage Type
Purchase Money Mortgage
Purchase Details
Closed on
Feb 20, 2004
Sold by
Shanzer Harriet E and Shanzer Herbert M
Bought by
Chanticleer Road Rt and Shanzer Harriet E
Create a Home Valuation Report for This Property
The Home Valuation Report is an in-depth analysis detailing your home's value as well as a comparison with similar homes in the area
Home Values in the Area
Average Home Value in this Area
Purchase History
| Date | Buyer | Sale Price | Title Company |
|---|---|---|---|
| Martin Chad | $785,000 | -- | |
| Zelamsky Leslie B | $885,000 | -- | |
| Chanticleer Road Rt | -- | -- |
Source: Public Records
Mortgage History
| Date | Status | Borrower | Loan Amount |
|---|---|---|---|
| Open | Martin Chad | $628,000 | |
| Previous Owner | Zelamsky Leslie B | $630,000 |
Source: Public Records
Tax History Compared to Growth
Tax History
| Year | Tax Paid | Tax Assessment Tax Assessment Total Assessment is a certain percentage of the fair market value that is determined by local assessors to be the total taxable value of land and additions on the property. | Land | Improvement |
|---|---|---|---|---|
| 2025 | $19,388 | $1,324,300 | $548,400 | $775,900 |
| 2024 | $18,685 | $1,278,900 | $532,400 | $746,500 |
| 2023 | $17,360 | $1,100,800 | $475,600 | $625,200 |
| 2022 | $17,283 | $957,500 | $436,400 | $521,100 |
| 2021 | $16,444 | $873,300 | $436,400 | $436,900 |
| 2020 | $15,690 | $850,400 | $436,400 | $414,000 |
| 2019 | $15,231 | $850,400 | $436,400 | $414,000 |
| 2018 | $15,079 | $841,000 | $464,000 | $377,000 |
| 2017 | $14,776 | $832,900 | $459,600 | $373,300 |
| 2016 | $14,315 | $804,200 | $442,000 | $362,200 |
| 2015 | $13,953 | $792,800 | $438,000 | $354,800 |
| 2014 | $13,952 | $773,800 | $426,400 | $347,400 |
Source: Public Records
Map
Nearby Homes
- 57 Longfellow Rd
- 5 Taintor Dr
- 589 North Rd
- 10 Oak Ridge Dr Unit 5
- 250 Great Rd
- 5 Oak Ridge Dr Unit 7
- 166 Parker St Unit 4
- 67 Powder Mill Rd
- 55 Widow Rites Ln
- 45 Widow Rites Ln
- 5 Hayes St Unit 5
- 15 Arthur St Unit 15
- 13 Arthur St Unit 15
- 16 Blacksmith Dr
- 28 Waltham St Unit B
- 54 Phillips Rd
- 22-26 Waltham St
- 22 Garfield Ave
- 11 Barnet Rd
- 42 Dakin Rd
- 41 Chanticleer Rd
- 55 Chanticleer Rd
- 48 Chanticleer Rd
- 56 Chanticleer Rd
- 42 Chanticleer Rd
- 33 Chanticleer Rd
- 63 Chanticleer Rd
- 82 Ford Rd
- 34 Chanticleer Rd
- 123 Longfellow Rd
- 88 Ford Rd
- 115 Longfellow Rd
- 131 Longfellow Rd
- 96 Ford Rd
- 74 Ford Rd
- 27 Chanticleer Rd
- 26 Chanticleer Rd
- 141 Longfellow Rd
- 71 Chanticleer Rd
- 108 Ford Rd