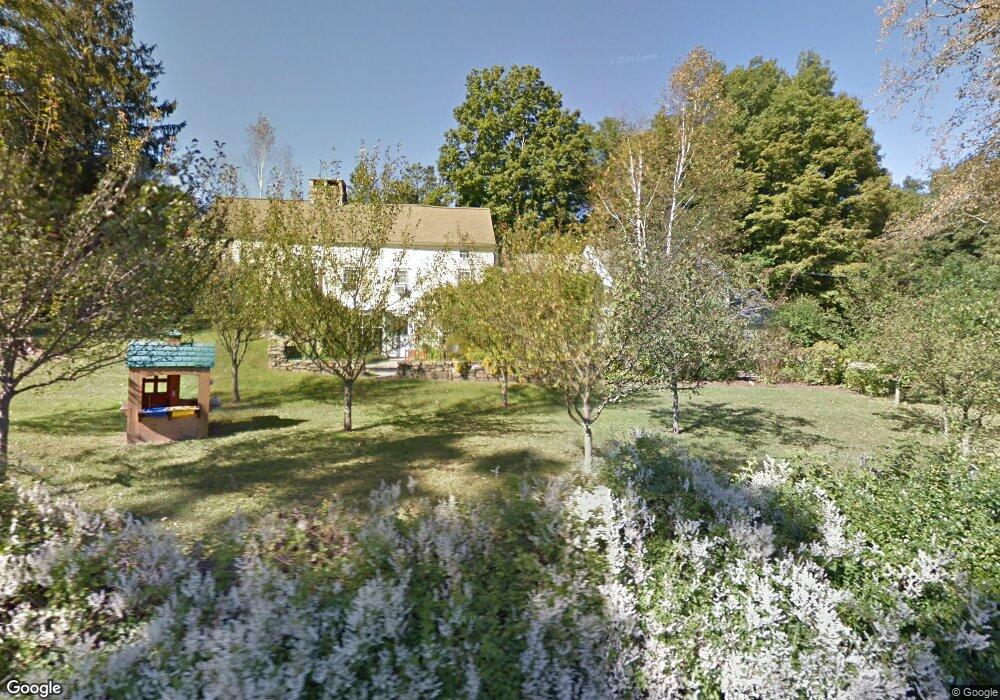
47 Cherniske Rd New Milford, CT 06776
Estimated Value: $681,000 - $897,000
5
Beds
3
Baths
2,217
Sq Ft
$355/Sq Ft
Est. Value
About This Home
This home is located at 47 Cherniske Rd, New Milford, CT 06776 and is currently estimated at $786,637, approximately $354 per square foot. 47 Cherniske Rd is a home located in Litchfield County with nearby schools including Northville Elementary School, Arroyo Elementary School, and John Muir Elementary School.
Ownership History
Date
Name
Owned For
Owner Type
Purchase Details
Closed on
Nov 12, 2013
Sold by
Fisch Alina
Bought by
Alina Fisch Ret and Fisch Alina
Current Estimated Value
Purchase Details
Closed on
Mar 6, 2007
Sold by
Law Lindsay
Bought by
Fisch Alina
Home Financials for this Owner
Home Financials are based on the most recent Mortgage that was taken out on this home.
Original Mortgage
$650,000
Interest Rate
5.87%
Purchase Details
Closed on
Jun 11, 2003
Sold by
Leonard Valerie
Bought by
Law Lindsay
Home Financials for this Owner
Home Financials are based on the most recent Mortgage that was taken out on this home.
Original Mortgage
$592,500
Interest Rate
4.62%
Purchase Details
Closed on
Dec 10, 1999
Sold by
Pellegrini Sharon
Bought by
Leonard Paul and Leonard Valerie
Create a Home Valuation Report for This Property
The Home Valuation Report is an in-depth analysis detailing your home's value as well as a comparison with similar homes in the area
Home Values in the Area
Average Home Value in this Area
Purchase History
| Date | Buyer | Sale Price | Title Company |
|---|---|---|---|
| Alina Fisch Ret | -- | -- | |
| Fisch Alina | $1,155,000 | -- | |
| Law Lindsay | $790,000 | -- | |
| Leonard Paul | $455,000 | -- |
Source: Public Records
Mortgage History
| Date | Status | Borrower | Loan Amount |
|---|---|---|---|
| Previous Owner | Leonard Paul | $650,000 | |
| Previous Owner | Leonard Paul | $592,500 | |
| Previous Owner | Leonard Paul | $118,000 |
Source: Public Records
Tax History Compared to Growth
Tax History
| Year | Tax Paid | Tax Assessment Tax Assessment Total Assessment is a certain percentage of the fair market value that is determined by local assessors to be the total taxable value of land and additions on the property. | Land | Improvement |
|---|---|---|---|---|
| 2025 | $15,248 | $320,080 | $64,090 | $255,990 |
| 2024 | $9,529 | $320,080 | $64,090 | $255,990 |
| 2023 | $9,276 | $320,080 | $64,090 | $255,990 |
| 2022 | $9,074 | $320,080 | $64,090 | $255,990 |
| 2021 | $8,953 | $320,080 | $64,090 | $255,990 |
| 2020 | $8,362 | $291,550 | $71,120 | $220,430 |
| 2019 | $8,367 | $291,550 | $71,120 | $220,430 |
| 2018 | $8,213 | $291,550 | $71,120 | $220,430 |
| 2017 | $7,945 | $291,550 | $71,120 | $220,430 |
| 2016 | $7,805 | $291,550 | $71,120 | $220,430 |
| 2015 | $6,835 | $255,500 | $71,120 | $184,380 |
| 2014 | $6,720 | $255,500 | $71,120 | $184,380 |
Source: Public Records
Map
Nearby Homes
- 10 Biliski Rd
- 217 Sawyer Hill Rd
- 52 Squire Hill Rd
- 2 Chapel Hill Rd
- 15 Connelly Rd
- 7 Owls Nest
- 27 Bridle Rd
- 35 Hillendale Dr
- 62 Big Bear Hill Rd
- 14 Straight Rd
- 57 Indian Trail Rd
- 226 Tinker Hill Rd
- 39 Treasure Hill Rd
- 35 Quarry Ridge Rd Unit 35
- 29 Quarry Ridge Rd
- 93 Quarry Ridge Rd Unit 93
- 198 Tinker Hill Rd
- 10 Harmony Trail
- 1 Blossom Ct Unit 1
- 15 Harmony Trail
- 48 Cherniske Rd
- 43 Cherniske Rd
- 37 Cherniske Rd
- 44 Cherniske Rd
- 30 Cherniske Rd
- 64 Cherniske Rd
- 64 Cherniske Rd
- 31 Cherniske Rd
- 33 Cherniske Rd
- 17 Biliski Rd
- 40 Cherniske Rd
- 65 Cherniske Rd
- 21 Biliski Rd
- 21 Frenchmans Rd
- 13 Biliski Rd
- 35 Cherniske Rd
- 35 Cherniske Rd Unit B
- 69 Cherniske Rd
- 18 Biliski Rd
- 5 Frenchmans Rd