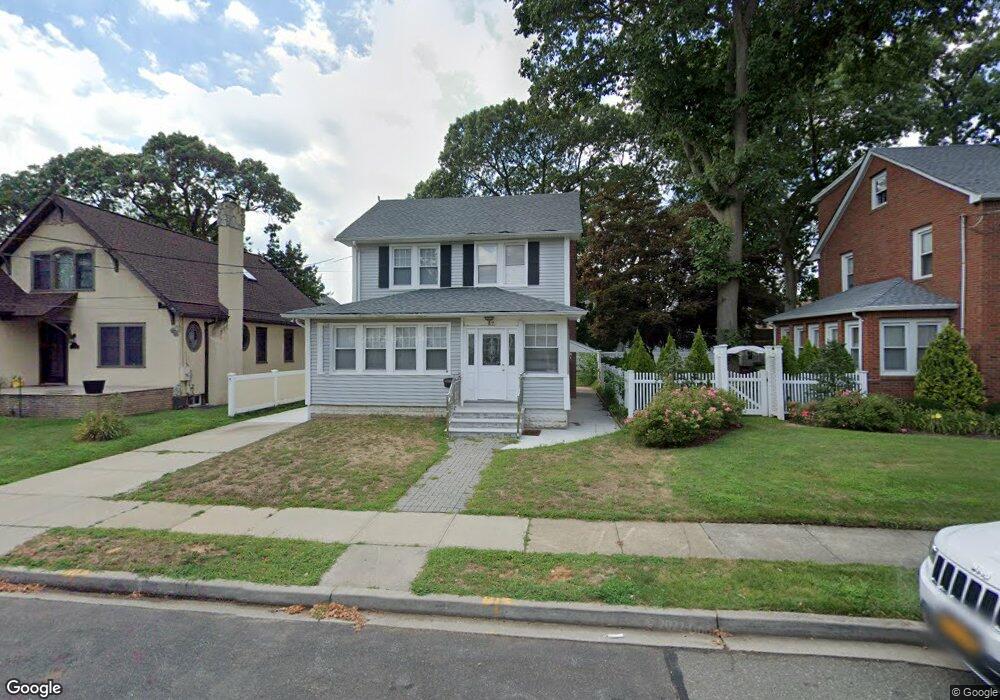
47 Christabel St Lynbrook, NY 11563
Estimated Value: $705,000 - $720,184
3
Beds
3
Baths
1,318
Sq Ft
$541/Sq Ft
Est. Value
About This Home
This home is located at 47 Christabel St, Lynbrook, NY 11563 and is currently estimated at $712,592, approximately $540 per square foot. 47 Christabel St is a home located in Nassau County with nearby schools including Davison Avenue Intermediate School, Maurice W. Downing Primary K-2 School, and Howard T Herber Middle School.
Ownership History
Date
Name
Owned For
Owner Type
Purchase Details
Closed on
Aug 5, 2021
Sold by
Durisile Stephan
Bought by
Rambarran Arun and Rambarran Uma Jagnarine
Current Estimated Value
Home Financials for this Owner
Home Financials are based on the most recent Mortgage that was taken out on this home.
Original Mortgage
$420,000
Interest Rate
2.8%
Mortgage Type
Seller Take Back
Purchase Details
Closed on
Jun 24, 2014
Sold by
Durisile Marie
Bought by
Durisile Stephan
Purchase Details
Closed on
Apr 22, 2005
Sold by
Lamere Donald
Bought by
Durisile Marie
Purchase Details
Closed on
Feb 7, 1996
Sold by
Covelli Ronald and Covelli Jean
Bought by
Lamere Donald and Lamere Kathleen
Home Financials for this Owner
Home Financials are based on the most recent Mortgage that was taken out on this home.
Original Mortgage
$136,000
Interest Rate
7.04%
Create a Home Valuation Report for This Property
The Home Valuation Report is an in-depth analysis detailing your home's value as well as a comparison with similar homes in the area
Home Values in the Area
Average Home Value in this Area
Purchase History
| Date | Buyer | Sale Price | Title Company |
|---|---|---|---|
| Rambarran Arun | $422,500 | First American Title | |
| Durisile Stephan | -- | -- | |
| Durisile Marie | $380,000 | -- | |
| Lamere Donald | $170,000 | -- |
Source: Public Records
Mortgage History
| Date | Status | Borrower | Loan Amount |
|---|---|---|---|
| Previous Owner | Rambarran Arun | $420,000 | |
| Previous Owner | Lamere Donald | $136,000 |
Source: Public Records
Tax History
| Year | Tax Paid | Tax Assessment Tax Assessment Total Assessment is a certain percentage of the fair market value that is determined by local assessors to be the total taxable value of land and additions on the property. | Land | Improvement |
|---|---|---|---|---|
| 2025 | $9,278 | $426 | $181 | $245 |
| 2024 | $1,017 | $456 | $194 | $262 |
Source: Public Records
Map
Nearby Homes
- 137 Charles St
- 58 Chestnut St
- 42 Driving Park Ave
- 21 Washington Ave
- 45 Lynbrook Ave
- 25 Centre St
- 212 Lakeview Ave
- 367 Vincent Ave
- 30 York St
- 266 Earle Ave
- 157 Hempstead Ave Unit B20
- 60 Hempstead Ave Unit 1K
- 60 Hempstead Ave Unit 1J
- 437 Yale Ave
- 63 Central Ave
- 17 Oxford St
- 75 Noble St Unit 126
- 75 Noble St Unit 121
- 90 Pearsall Ave
- 49 Malden Ave
Your Personal Tour Guide
Ask me questions while you tour the home.