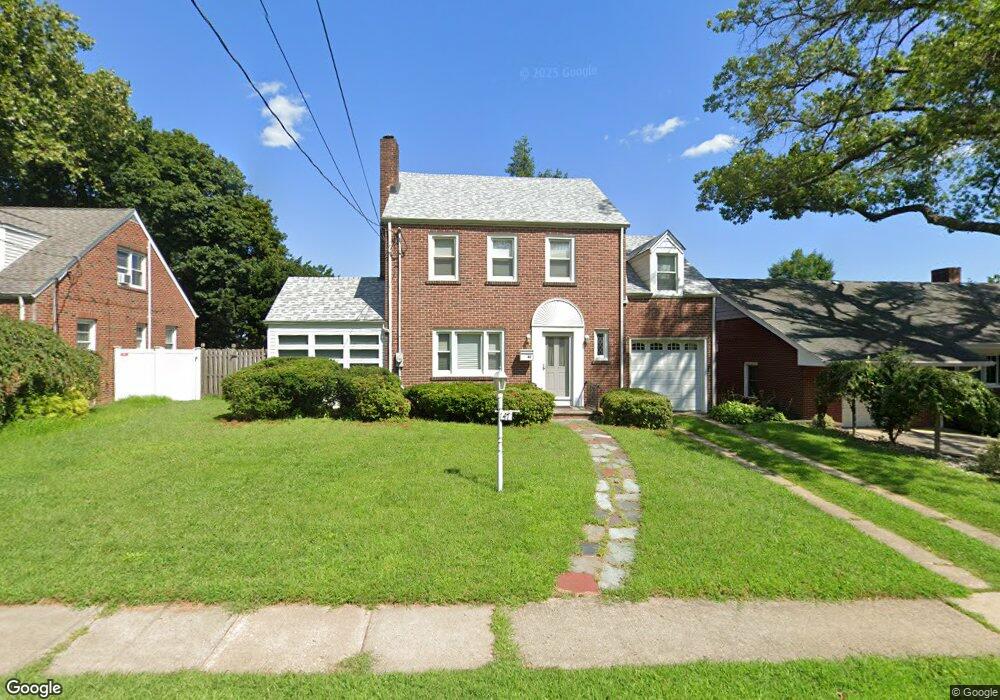
47 Colfax St South River, NJ 08882
Estimated Value: $459,000 - $538,000
3
Beds
2
Baths
1,664
Sq Ft
$304/Sq Ft
Est. Value
About This Home
This home is located at 47 Colfax St, South River, NJ 08882 and is currently estimated at $505,793, approximately $303 per square foot. 47 Colfax St is a home located in Middlesex County with nearby schools including South River Primary School, South River Elementary School, and South River Middle School.
Ownership History
Date
Name
Owned For
Owner Type
Purchase Details
Closed on
Aug 17, 2006
Sold by
Kondracki Mark
Bought by
Mayo Donald
Current Estimated Value
Purchase Details
Closed on
Jun 17, 2005
Sold by
Molnar Joann
Bought by
Kondracki Kim
Home Financials for this Owner
Home Financials are based on the most recent Mortgage that was taken out on this home.
Original Mortgage
$276,000
Interest Rate
5.25%
Mortgage Type
Adjustable Rate Mortgage/ARM
Purchase Details
Closed on
Nov 24, 2003
Sold by
Krosnowski Theresa E
Bought by
Molnar Joann E
Create a Home Valuation Report for This Property
The Home Valuation Report is an in-depth analysis detailing your home's value as well as a comparison with similar homes in the area
Home Values in the Area
Average Home Value in this Area
Purchase History
| Date | Buyer | Sale Price | Title Company |
|---|---|---|---|
| Mayo Donald | $395,000 | -- | |
| Kondracki Kim | $345,500 | -- | |
| Molnar Joann E | -- | -- |
Source: Public Records
Mortgage History
| Date | Status | Borrower | Loan Amount |
|---|---|---|---|
| Previous Owner | Kondracki Kim | $276,000 |
Source: Public Records
Tax History Compared to Growth
Tax History
| Year | Tax Paid | Tax Assessment Tax Assessment Total Assessment is a certain percentage of the fair market value that is determined by local assessors to be the total taxable value of land and additions on the property. | Land | Improvement |
|---|---|---|---|---|
| 2025 | $7,870 | $309,000 | $120,000 | $189,000 |
| 2024 | $7,635 | $309,000 | $120,000 | $189,000 |
| 2023 | $7,635 | $309,000 | $120,000 | $189,000 |
| 2022 | $7,503 | $309,000 | $120,000 | $189,000 |
| 2021 | $5,377 | $309,000 | $120,000 | $189,000 |
| 2020 | $7,067 | $309,000 | $120,000 | $189,000 |
| 2019 | $7,092 | $86,100 | $23,900 | $62,200 |
| 2018 | $6,922 | $86,100 | $23,900 | $62,200 |
| 2017 | $6,668 | $86,100 | $23,900 | $62,200 |
| 2016 | $6,416 | $86,100 | $23,900 | $62,200 |
| 2015 | $6,272 | $86,100 | $23,900 | $62,200 |
| 2014 | $6,129 | $86,100 | $23,900 | $62,200 |
Source: Public Records
Map
Nearby Homes