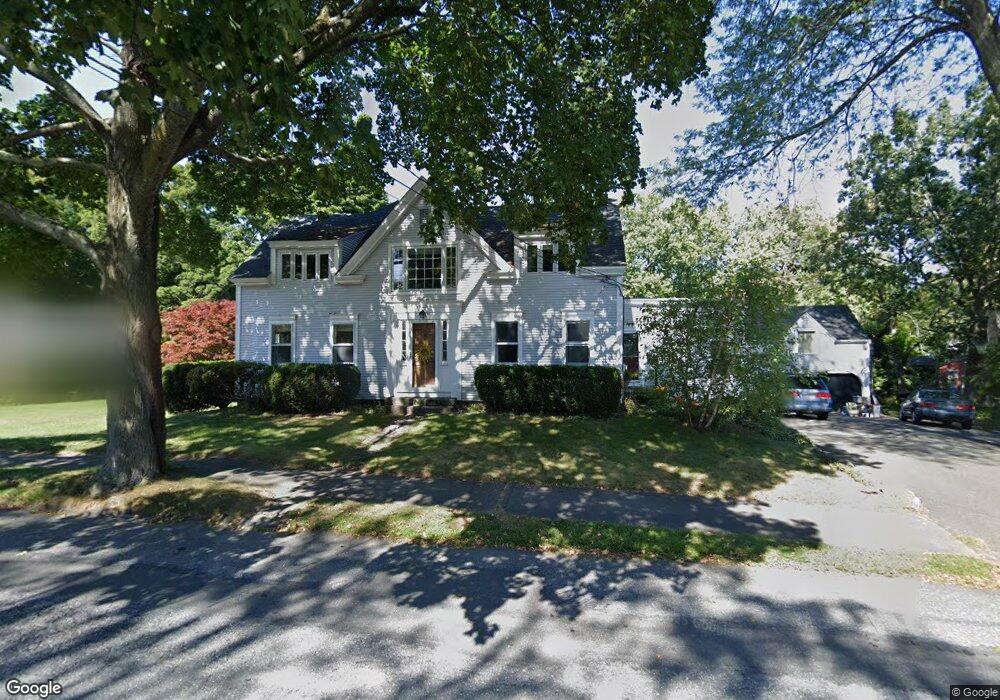
47 Cordis St Wakefield, MA 01880
Lakeside NeighborhoodEstimated Value: $957,000 - $1,161,000
4
Beds
2
Baths
2,784
Sq Ft
$384/Sq Ft
Est. Value
About This Home
This home is located at 47 Cordis St, Wakefield, MA 01880 and is currently estimated at $1,070,057, approximately $384 per square foot. 47 Cordis St is a home located in Middlesex County with nearby schools including Wakefield Memorial High School, St Joseph School, and Odyssey Day School.
Ownership History
Date
Name
Owned For
Owner Type
Purchase Details
Closed on
May 30, 2013
Sold by
Carrier Ft
Bought by
Carrier Kenneth and Carrier Wendy J
Current Estimated Value
Home Financials for this Owner
Home Financials are based on the most recent Mortgage that was taken out on this home.
Original Mortgage
$400,000
Outstanding Balance
$284,029
Interest Rate
3.45%
Mortgage Type
New Conventional
Estimated Equity
$786,028
Create a Home Valuation Report for This Property
The Home Valuation Report is an in-depth analysis detailing your home's value as well as a comparison with similar homes in the area
Home Values in the Area
Average Home Value in this Area
Purchase History
| Date | Buyer | Sale Price | Title Company |
|---|---|---|---|
| Carrier Kenneth | -- | -- |
Source: Public Records
Mortgage History
| Date | Status | Borrower | Loan Amount |
|---|---|---|---|
| Open | Carrier Kenneth | $400,000 |
Source: Public Records
Tax History Compared to Growth
Tax History
| Year | Tax Paid | Tax Assessment Tax Assessment Total Assessment is a certain percentage of the fair market value that is determined by local assessors to be the total taxable value of land and additions on the property. | Land | Improvement |
|---|---|---|---|---|
| 2025 | $11,402 | $1,004,600 | $454,600 | $550,000 |
| 2024 | $10,522 | $935,300 | $422,900 | $512,400 |
| 2023 | $10,249 | $873,700 | $394,700 | $479,000 |
| 2022 | $9,626 | $781,300 | $352,400 | $428,900 |
| 2021 | $9,504 | $746,600 | $328,200 | $418,400 |
| 2020 | $8,939 | $700,000 | $307,700 | $392,300 |
| 2019 | $8,382 | $653,300 | $287,100 | $366,200 |
| 2018 | $8,082 | $624,100 | $274,300 | $349,800 |
| 2017 | $7,602 | $583,400 | $256,400 | $327,000 |
| 2016 | $7,719 | $572,200 | $254,900 | $317,300 |
| 2015 | $7,216 | $535,300 | $238,200 | $297,100 |
| 2014 | $6,678 | $522,500 | $232,400 | $290,100 |
Source: Public Records
Map
Nearby Homes
- 48 Cordis St
- 29 Cordis St
- 22 Wayland Rd
- 270 Lowell St
- 1 Mansfield Dr
- 13 Highland St
- 18 Paon Blvd
- 24 Park St
- 16 Pleasant St
- 11 Wilson Ave
- 9 Avon St Unit 2
- 20 N Emerson St Unit 20
- 51 Crescent St
- 50 Quannapowitt Pkwy
- 10 Wolcott St
- 50 Albion St
- 47 Emerson St
- 6 Blue Jay Cir Unit 2
- 6 Avon Ct Unit 2
- 3 Garden Ln