47 Crest Rd Southington, CT 06489
East Southington NeighborhoodEstimated Value: $328,846 - $402,000
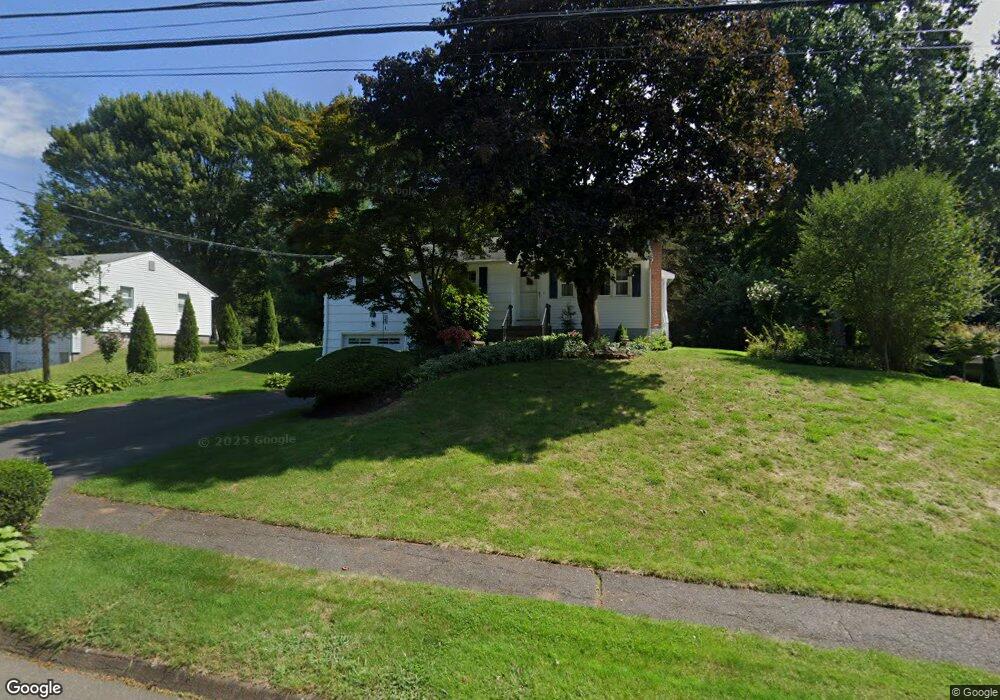
About This Home
This home is located at 47 Crest Rd, Southington, CT 06489 and is currently estimated at $368,712, approximately $347 per square foot. 47 Crest Rd is a home located in Hartford County with nearby schools including Reuben E. Thalberg Elementary School, Joseph A. Depaolo Middle School, and Southington High School.
Ownership History
We collect this data history from publicly available records. To have your information removed, we recommend requesting removal directly through your county’s website.
Purchase Details
Home Financials for this Owner
Home Financials are based on the most recent Mortgage that was taken out on this home.Home Values in the Area
Average Home Value in this Area
Purchase History
We collect this data history from publicly available records. To have your information removed, we recommend requesting removal directly through your county’s website.
| Date | Buyer | Sale Price | Title Company |
|---|---|---|---|
| $137,000 | -- |
Mortgage History
We collect this data history from publicly available records. To have your information removed, we recommend requesting removal directly through your county’s website.
| Date | Status | Borrower | Loan Amount |
|---|---|---|---|
| Open | $93,830 | ||
| Closed | $100,000 | ||
| Closed | $97,000 | ||
| Previous Owner | $107,200 |
Tax History
We collect this data history from publicly available records. To have your information removed, we recommend requesting removal directly through your county’s website.
| Year | Tax Paid | Tax Assessment Tax Assessment Total Assessment is a certain percentage of the fair market value that is determined by local assessors to be the total taxable value of land and additions on the property. | Land | Improvement |
|---|---|---|---|---|
| 2025 | $4,528 | $136,340 | $65,120 | $71,220 |
| 2024 | $4,287 | $136,340 | $65,120 | $71,220 |
| 2023 | $4,139 | $136,340 | $65,120 | $71,220 |
| 2022 | $3,972 | $136,340 | $65,120 | $71,220 |
| 2021 | $3,958 | $136,340 | $65,120 | $71,220 |
| 2020 | $4,036 | $131,770 | $66,450 | $65,320 |
| 2019 | $4,037 | $131,770 | $66,450 | $65,320 |
| 2018 | $4,016 | $131,770 | $66,450 | $65,320 |
| 2017 | $4,016 | $131,770 | $66,450 | $65,320 |
| 2016 | $3,906 | $131,770 | $66,450 | $65,320 |
| 2015 | $3,876 | $133,000 | $56,950 | $76,050 |
| 2014 | $3,772 | $133,000 | $56,950 | $76,050 |
Map
- 160 Flanders Rd
- 6 Wilton Rd
- 101 Wedgewood Rd
- 890 Woodruff St
- 195 Sun Valley Dr
- 144 Sun Valley Dr
- 302 Spring Lake Rd
- 82 Cianci Dr
- 1171 Woodruff St
- 1218 Woodruff St
- 96 Fox Run Dr
- 195 Pleasant St
- 402 Lakeview Dr
- 342 Songbird Ln Unit 342
- 90 Baldwin Cir
- 6 Lakeview Dr
- 550 Darling St Unit 5H
- 550 Darling St Unit 42B
- 344 Andrews St
- 500 Darling St Unit 11Q
Ask me questions while you tour the home.