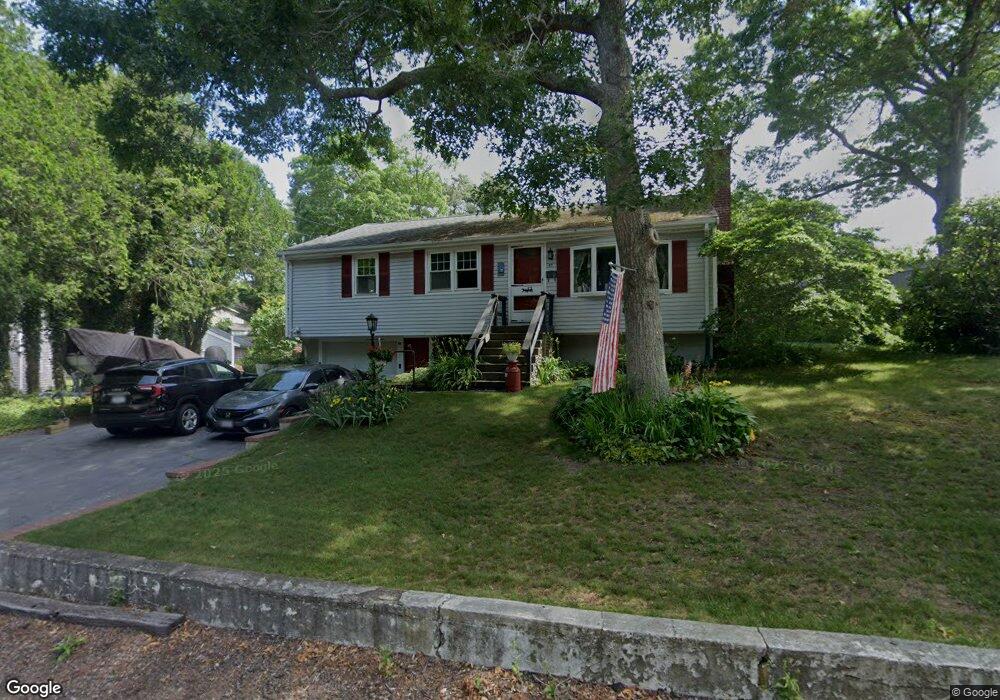
47 Cypress St Buzzards Bay, MA 02532
Buzzards Bay NeighborhoodEstimated Value: $528,000 - $614,000
3
Beds
2
Baths
1,201
Sq Ft
$467/Sq Ft
Est. Value
About This Home
This home is located at 47 Cypress St, Buzzards Bay, MA 02532 and is currently estimated at $560,352, approximately $466 per square foot. 47 Cypress St is a home located in Barnstable County with nearby schools including Bourne High School and St Margaret Regional School.
Ownership History
Date
Name
Owned For
Owner Type
Purchase Details
Closed on
Apr 10, 1997
Sold by
Marchand Thomas H and Bogigian Maureen
Bought by
Ruggeri Robert D and Ruggeri Colleen R
Current Estimated Value
Purchase Details
Closed on
Sep 7, 1995
Sold by
Coulombe Henri C and Coulombe Claire M
Bought by
Marchand Thomas H and Bogigian Maureen
Create a Home Valuation Report for This Property
The Home Valuation Report is an in-depth analysis detailing your home's value as well as a comparison with similar homes in the area
Home Values in the Area
Average Home Value in this Area
Purchase History
| Date | Buyer | Sale Price | Title Company |
|---|---|---|---|
| Ruggeri Robert D | $123,000 | -- | |
| Ruggeri Robert D | $123,000 | -- | |
| Marchand Thomas H | $116,000 | -- | |
| Marchand Thomas H | $116,000 | -- |
Source: Public Records
Mortgage History
| Date | Status | Borrower | Loan Amount |
|---|---|---|---|
| Open | Marchand Thomas H | $50,000 | |
| Open | Marchand Thomas H | $159,000 |
Source: Public Records
Tax History
| Year | Tax Paid | Tax Assessment Tax Assessment Total Assessment is a certain percentage of the fair market value that is determined by local assessors to be the total taxable value of land and additions on the property. | Land | Improvement |
|---|---|---|---|---|
| 2025 | $3,539 | $453,100 | $178,600 | $274,500 |
| 2024 | $3,460 | $431,400 | $170,100 | $261,300 |
| 2023 | $3,364 | $381,800 | $150,500 | $231,300 |
| 2022 | $3,197 | $316,800 | $133,200 | $183,600 |
| 2021 | $3,105 | $288,300 | $121,200 | $167,100 |
| 2020 | $2,998 | $279,100 | $120,100 | $159,000 |
| 2019 | $1,552 | $272,100 | $120,100 | $152,000 |
| 2018 | $2,593 | $246,000 | $108,600 | $137,400 |
| 2017 | $2,510 | $243,700 | $107,600 | $136,100 |
| 2016 | $2,295 | $225,900 | $96,300 | $129,600 |
| 2015 | $2,275 | $225,900 | $96,300 | $129,600 |
Source: Public Records
Map
Nearby Homes
- 58 Maple St
- 48 Maple St
- 304 Main St
- 23 Alderberry Rd
- 38 Old Bridge Rd
- 6 Honora Ct
- 46 Holt Rd Unit A
- 46 Holt Rd
- 60 Sandwich Rd
- 40-A Lafayette Ave
- 4 Van Bummel Rd
- 44 Cotuit Rd
- 10 Sandy Ln
- 810 Head of The Bay Rd
- 9 Hideaway Rd Unit F
- 5 Zoli Ln
- 13 Hideaway Village Unit G
- 24 Ships View Terrace
- 4 Mainstay Ln
- 13 Laurel Hill Ct
Your Personal Tour Guide
Ask me questions while you tour the home.