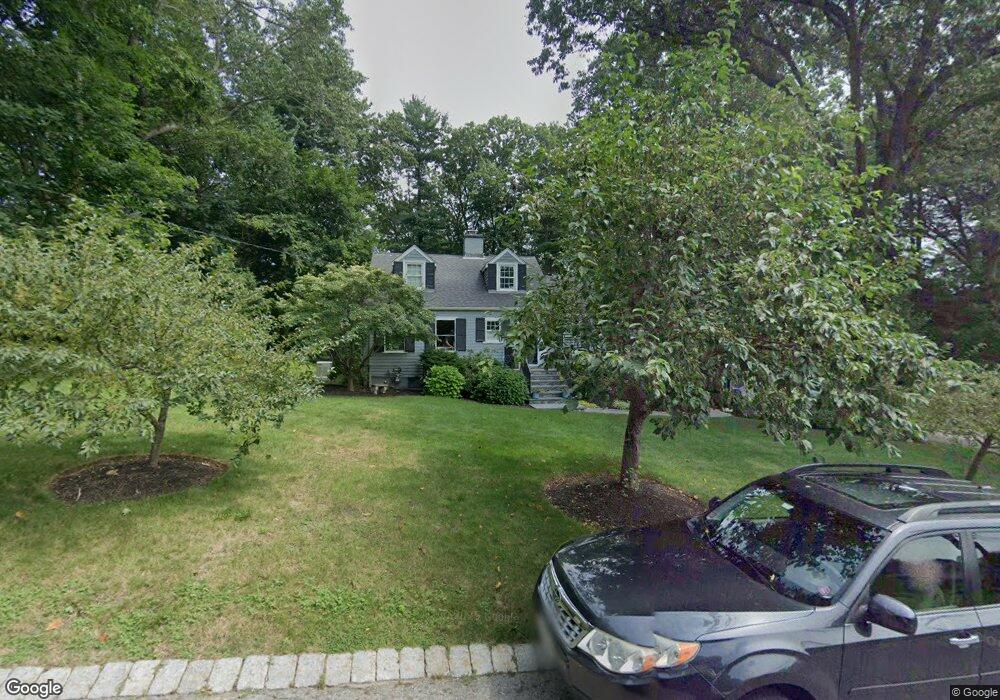
47 Dean Rd Weston, MA 02493
Estimated Value: $1,705,938 - $2,200,000
2
Beds
4
Baths
2,675
Sq Ft
$722/Sq Ft
Est. Value
About This Home
This home is located at 47 Dean Rd, Weston, MA 02493 and is currently estimated at $1,931,485, approximately $722 per square foot. 47 Dean Rd is a home located in Middlesex County with nearby schools including Country Elementary School, Woodland Elementary School, and Field Elementary School.
Ownership History
Date
Name
Owned For
Owner Type
Purchase Details
Closed on
Jun 30, 1995
Sold by
Potts David L and Onorato Lisa F
Bought by
Packs John N and Packs Marion B
Current Estimated Value
Purchase Details
Closed on
Apr 14, 1994
Sold by
Rubenstein Lee A and Rubenstein Margaret T
Bought by
Onorato Lisa F and Potts David L
Create a Home Valuation Report for This Property
The Home Valuation Report is an in-depth analysis detailing your home's value as well as a comparison with similar homes in the area
Home Values in the Area
Average Home Value in this Area
Purchase History
| Date | Buyer | Sale Price | Title Company |
|---|---|---|---|
| Packs John N | $542,500 | -- | |
| Onorato Lisa F | $490,000 | -- |
Source: Public Records
Mortgage History
| Date | Status | Borrower | Loan Amount |
|---|---|---|---|
| Open | Onorato Lisa F | $415,800 | |
| Closed | Onorato Lisa F | $427,000 |
Source: Public Records
Tax History
| Year | Tax Paid | Tax Assessment Tax Assessment Total Assessment is a certain percentage of the fair market value that is determined by local assessors to be the total taxable value of land and additions on the property. | Land | Improvement |
|---|---|---|---|---|
| 2025 | $16,518 | $1,488,100 | $1,013,900 | $474,200 |
| 2024 | $16,229 | $1,459,400 | $1,013,900 | $445,500 |
| 2023 | $16,203 | $1,368,500 | $1,013,900 | $354,600 |
| 2022 | $15,788 | $1,232,500 | $955,700 | $276,800 |
| 2021 | $15,244 | $1,174,400 | $910,400 | $264,000 |
| 2020 | $14,807 | $1,154,100 | $910,400 | $243,700 |
| 2019 | $13,928 | $1,106,300 | $865,200 | $241,100 |
| 2018 | $13,299 | $1,063,100 | $865,200 | $197,900 |
| 2017 | $13,182 | $1,063,100 | $865,200 | $197,900 |
| 2016 | $12,927 | $1,063,100 | $865,200 | $197,900 |
| 2015 | $12,474 | $1,015,800 | $824,000 | $191,800 |
Source: Public Records
Map
Nearby Homes
Your Personal Tour Guide
Ask me questions while you tour the home.