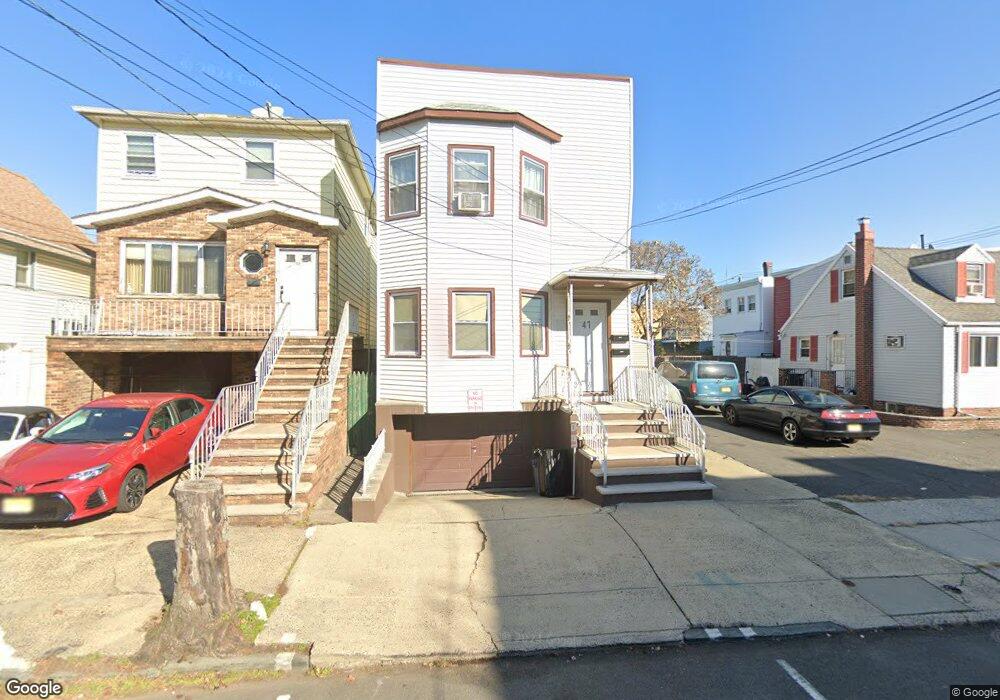
47 E 15th St Bayonne, NJ 07002
Constable Hook NeighborhoodEstimated Value: $436,000 - $566,000
--
Bed
--
Bath
1,442
Sq Ft
$362/Sq Ft
Est. Value
About This Home
This home is located at 47 E 15th St, Bayonne, NJ 07002 and is currently estimated at $521,657, approximately $361 per square foot. 47 E 15th St is a home located in Hudson County with nearby schools including Bayonne High School, All Saints Catholic Academy, and Beacon Christian Academy.
Ownership History
Date
Name
Owned For
Owner Type
Purchase Details
Closed on
Sep 23, 2020
Sold by
Archiello William
Bought by
Salick Jason
Current Estimated Value
Home Financials for this Owner
Home Financials are based on the most recent Mortgage that was taken out on this home.
Original Mortgage
$319,500
Outstanding Balance
$283,009
Interest Rate
2.8%
Mortgage Type
New Conventional
Estimated Equity
$238,648
Purchase Details
Closed on
May 1, 1997
Sold by
Mcdaniel A J and Mcdaniel Theresa
Bought by
Archiello William
Create a Home Valuation Report for This Property
The Home Valuation Report is an in-depth analysis detailing your home's value as well as a comparison with similar homes in the area
Home Values in the Area
Average Home Value in this Area
Purchase History
| Date | Buyer | Sale Price | Title Company |
|---|---|---|---|
| Salick Jason | $399,500 | Old Republic Title | |
| Archiello William | $110,000 | Fidelity National Title Ins |
Source: Public Records
Mortgage History
| Date | Status | Borrower | Loan Amount |
|---|---|---|---|
| Open | Salick Jason | $319,500 |
Source: Public Records
Tax History Compared to Growth
Tax History
| Year | Tax Paid | Tax Assessment Tax Assessment Total Assessment is a certain percentage of the fair market value that is determined by local assessors to be the total taxable value of land and additions on the property. | Land | Improvement |
|---|---|---|---|---|
| 2025 | $8,640 | $309,000 | $158,400 | $150,600 |
| 2024 | $8,290 | $309,000 | $158,400 | $150,600 |
| 2023 | $8,290 | $309,000 | $158,400 | $150,600 |
| 2022 | $8,136 | $309,000 | $158,400 | $150,600 |
| 2021 | $8,071 | $309,000 | $158,400 | $150,600 |
| 2020 | $7,929 | $309,000 | $158,400 | $150,600 |
| 2019 | $8,242 | $95,500 | $38,400 | $57,100 |
| 2018 | $8,077 | $95,500 | $38,400 | $57,100 |
| 2017 | $7,868 | $95,500 | $38,400 | $57,100 |
| 2016 | $7,578 | $95,500 | $38,400 | $57,100 |
| 2015 | $7,329 | $95,500 | $38,400 | $57,100 |
| 2014 | $7,110 | $95,500 | $38,400 | $57,100 |
Source: Public Records
Map
Nearby Homes