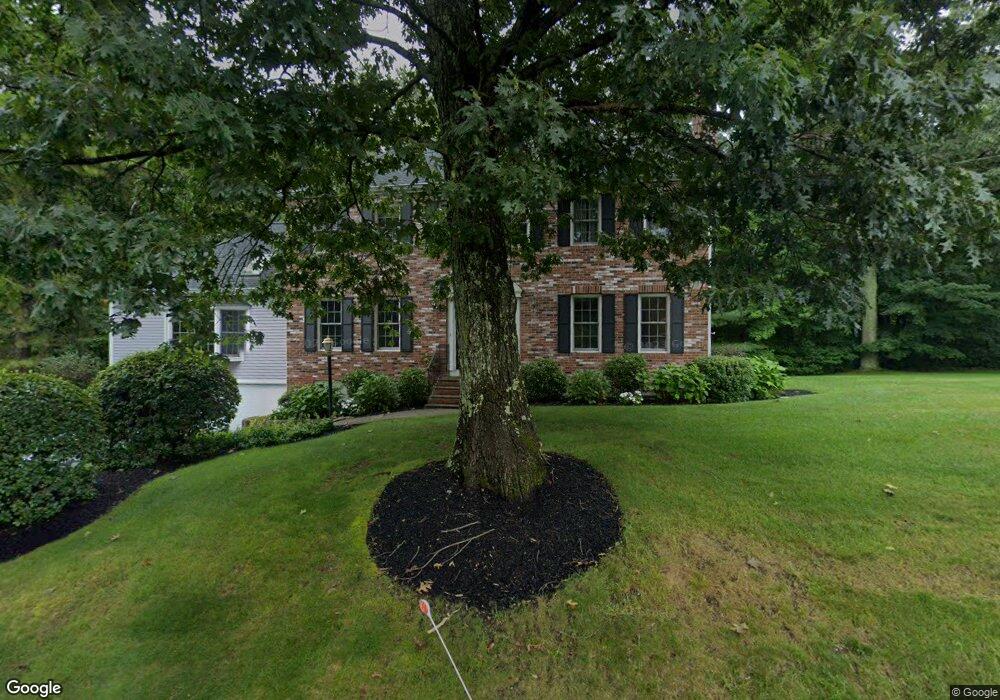
47 E Main St Southborough, MA 01772
Estimated Value: $1,015,540 - $1,052,000
4
Beds
3
Baths
2,856
Sq Ft
$361/Sq Ft
Est. Value
About This Home
This home is located at 47 E Main St, Southborough, MA 01772 and is currently estimated at $1,030,513, approximately $360 per square foot. 47 E Main St is a home located in Worcester County with nearby schools including Mary E Finn School, Albert S. Woodward Memorial School, and Margaret A. Neary School.
Ownership History
Date
Name
Owned For
Owner Type
Purchase Details
Closed on
Aug 9, 2012
Sold by
Weber Kevin G and Weber Margaret D
Bought by
Km Weber Ret and Weber Kevin G
Current Estimated Value
Purchase Details
Closed on
Oct 14, 1994
Sold by
Crow William F and Crow Martha
Bought by
Weber Kevin G and Weber Margaret
Home Financials for this Owner
Home Financials are based on the most recent Mortgage that was taken out on this home.
Original Mortgage
$313,650
Interest Rate
8.43%
Mortgage Type
Purchase Money Mortgage
Create a Home Valuation Report for This Property
The Home Valuation Report is an in-depth analysis detailing your home's value as well as a comparison with similar homes in the area
Home Values in the Area
Average Home Value in this Area
Purchase History
| Date | Buyer | Sale Price | Title Company |
|---|---|---|---|
| Km Weber Ret | -- | -- | |
| Weber Kevin G | $348,500 | -- |
Source: Public Records
Mortgage History
| Date | Status | Borrower | Loan Amount |
|---|---|---|---|
| Previous Owner | Weber Kevin G | $313,650 |
Source: Public Records
Tax History
| Year | Tax Paid | Tax Assessment Tax Assessment Total Assessment is a certain percentage of the fair market value that is determined by local assessors to be the total taxable value of land and additions on the property. | Land | Improvement |
|---|---|---|---|---|
| 2025 | $14,191 | $1,027,600 | $335,900 | $691,700 |
| 2024 | $13,635 | $980,200 | $331,200 | $649,000 |
| 2023 | $12,837 | $869,700 | $313,400 | $556,300 |
| 2022 | $11,894 | $730,600 | $272,700 | $457,900 |
| 2021 | $11,712 | $722,500 | $277,400 | $445,100 |
| 2020 | $11,654 | $699,500 | $270,400 | $429,100 |
| 2019 | $11,259 | $672,600 | $256,100 | $416,500 |
| 2018 | $10,488 | $649,800 | $246,400 | $403,400 |
| 2017 | $10,406 | $635,300 | $246,400 | $388,900 |
| 2016 | $10,451 | $660,600 | $244,800 | $415,800 |
| 2015 | $10,261 | $640,500 | $230,300 | $410,200 |
Source: Public Records
Map
Nearby Homes
- 4 Latisquama Rd
- 24 Meadow Ln
- 26 Meadow Ln
- 14 Mitchell St
- 21 Carriage Hill Cir
- 1 Carriage Hill Cir Unit 1
- 47 Central St
- 61-65 Turnpike
- 19 Maplecrest Dr
- 12 Fayville Ln Unit 12
- 216 Boston Rd
- 150 Framingham Rd
- 10 Lorenzo Dr
- 14 Wolfpen Ln
- lot 1 Sears Rd
- 56 Sears Rd
- 7 Thomas Dr
- 32 Sears Rd
- 20 Clifford Rd
- 9A Ashley Rd
Your Personal Tour Guide
Ask me questions while you tour the home.