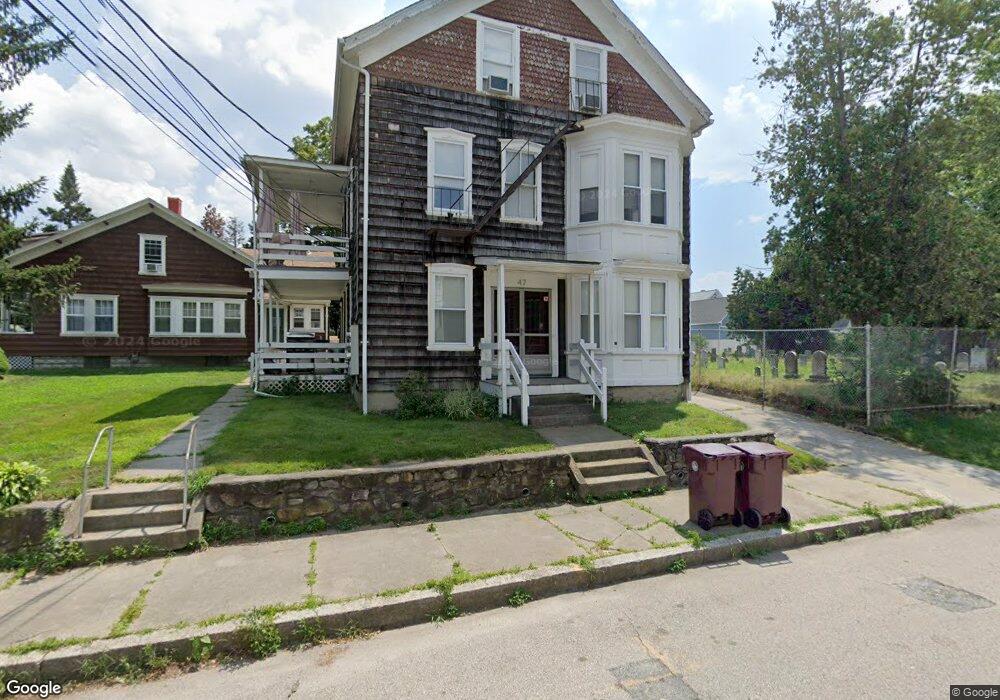
47 E Orchard St Woonsocket, RI 02895
Globe District NeighborhoodEstimated Value: $469,000 - $496,000
6
Beds
3
Baths
2,380
Sq Ft
$203/Sq Ft
Est. Value
About This Home
This home is located at 47 E Orchard St, Woonsocket, RI 02895 and is currently estimated at $482,500, approximately $202 per square foot. 47 E Orchard St is a home located in Providence County with nearby schools including Woonsocket High School, Founders Academy, and Beacon Charter School.
Ownership History
Date
Name
Owned For
Owner Type
Purchase Details
Closed on
Mar 29, 2010
Sold by
Wells Fargo Bk
Bought by
Taratuta Steven O
Current Estimated Value
Home Financials for this Owner
Home Financials are based on the most recent Mortgage that was taken out on this home.
Original Mortgage
$122,467
Outstanding Balance
$81,012
Interest Rate
5.02%
Mortgage Type
Purchase Money Mortgage
Estimated Equity
$401,488
Purchase Details
Closed on
Apr 4, 2006
Sold by
Florentz Albert and Florentz Margaret A
Bought by
Larue Justin B
Home Financials for this Owner
Home Financials are based on the most recent Mortgage that was taken out on this home.
Original Mortgage
$165,750
Interest Rate
6.32%
Mortgage Type
Purchase Money Mortgage
Purchase Details
Closed on
Jan 29, 1996
Sold by
Mandeville Constan Est
Bought by
Nason Margaret
Create a Home Valuation Report for This Property
The Home Valuation Report is an in-depth analysis detailing your home's value as well as a comparison with similar homes in the area
Home Values in the Area
Average Home Value in this Area
Purchase History
| Date | Buyer | Sale Price | Title Company |
|---|---|---|---|
| Taratuta Steven O | $89,900 | -- | |
| Wells Fargo Bk | $150,000 | -- | |
| Wells Fargo Bk | $150,000 | -- | |
| Larue Justin B | $255,000 | -- | |
| Larue Justin B | $255,000 | -- | |
| Nason Margaret | $60,000 | -- | |
| Nason Margaret | $60,000 | -- |
Source: Public Records
Mortgage History
| Date | Status | Borrower | Loan Amount |
|---|---|---|---|
| Open | Nason Margaret | $122,467 | |
| Closed | Nason Margaret | $0 | |
| Previous Owner | Nason Margaret | $165,750 |
Source: Public Records
Tax History
| Year | Tax Paid | Tax Assessment Tax Assessment Total Assessment is a certain percentage of the fair market value that is determined by local assessors to be the total taxable value of land and additions on the property. | Land | Improvement |
|---|---|---|---|---|
| 2025 | $4,810 | $428,300 | $87,900 | $340,400 |
| 2024 | $4,030 | $277,200 | $89,500 | $187,700 |
| 2023 | $3,875 | $277,200 | $89,500 | $187,700 |
| 2022 | $3,875 | $277,200 | $89,500 | $187,700 |
| 2021 | $3,427 | $144,300 | $35,600 | $108,700 |
| 2020 | $3,463 | $144,300 | $35,600 | $108,700 |
| 2018 | $3,475 | $144,300 | $35,600 | $108,700 |
| 2017 | $3,874 | $128,700 | $40,000 | $88,700 |
| 2016 | $4,098 | $128,700 | $40,000 | $88,700 |
| 2015 | $4,708 | $128,700 | $40,000 | $88,700 |
| 2014 | $4,536 | $126,200 | $44,000 | $82,200 |
Source: Public Records
Map
Nearby Homes
- 80 Summit St
- 43 Summit St
- 0 Holbrook Ln Unit 1402850
- 190 Coe St
- 122 Grand St
- 435 S Main St
- 182 Avenue C Unit 6
- 184 Avenue C Unit 2
- 184 Avenue C Unit 5
- 184 Avenue C Unit 6
- 184 Avenue C Unit 3
- 184 Avenue C Unit 1
- 184 Avenue C Unit 4
- 379 Front St
- 84 Bernice Ave
- 604 Providence St
- 1 Admiral St
- 15 Knight St
- 1060 Park Ave
- 92 Rockland Ave
- 71 Erie St
- 108 E Orchard St
- 116 E Orchard St
- 114 Collins St
- 86 E Orchard St
- 80 Erie St
- 126 Collins St
- 76 Erie St
- 76 Erie St Unit Second floor
- 98 Collins St
- 64 Erie St
- 158 Lincoln St
- 158 Lincoln St Unit 2nd Floor
- 158 Lincoln St
- 150 Lincoln St
- 150 Lincoln St Unit 3
- 150 Lincoln St Unit 2
- 0 Erie St
- 172 Lincoln St
- 78 Collins St
Your Personal Tour Guide
Ask me questions while you tour the home.