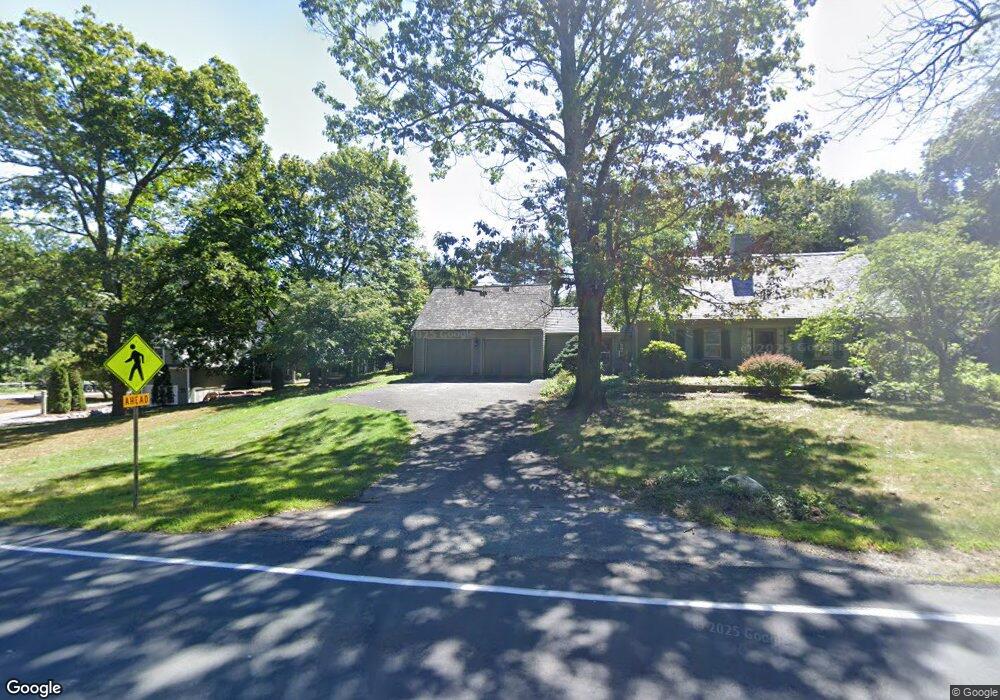
47 East St Hingham, MA 02043
Estimated Value: $1,349,000 - $1,550,000
3
Beds
3
Baths
2,132
Sq Ft
$678/Sq Ft
Est. Value
About This Home
This home is located at 47 East St, Hingham, MA 02043 and is currently estimated at $1,444,655, approximately $677 per square foot. 47 East St is a home located in Plymouth County with nearby schools including East Elementary School, St. Paul Elementary School, and Derby Academy.
Ownership History
Date
Name
Owned For
Owner Type
Purchase Details
Closed on
Oct 26, 2020
Sold by
Mcardle James C
Bought by
James C Mcardle Ret
Current Estimated Value
Purchase Details
Closed on
Jul 31, 1996
Sold by
Loughman Kieran J and Loughman Cecelia J
Bought by
Mcardle James C and Mcardle Joan M
Home Financials for this Owner
Home Financials are based on the most recent Mortgage that was taken out on this home.
Original Mortgage
$200,000
Interest Rate
8.27%
Mortgage Type
Purchase Money Mortgage
Create a Home Valuation Report for This Property
The Home Valuation Report is an in-depth analysis detailing your home's value as well as a comparison with similar homes in the area
Home Values in the Area
Average Home Value in this Area
Purchase History
| Date | Buyer | Sale Price | Title Company |
|---|---|---|---|
| James C Mcardle Ret | -- | None Available | |
| Mcardle James C | $360,000 | -- |
Source: Public Records
Mortgage History
| Date | Status | Borrower | Loan Amount |
|---|---|---|---|
| Previous Owner | Mcardle James C | $200,000 | |
| Previous Owner | Mcardle James C | $175,000 | |
| Previous Owner | Mcardle James C | $175,000 | |
| Previous Owner | Mcardle James C | $200,000 |
Source: Public Records
Tax History Compared to Growth
Tax History
| Year | Tax Paid | Tax Assessment Tax Assessment Total Assessment is a certain percentage of the fair market value that is determined by local assessors to be the total taxable value of land and additions on the property. | Land | Improvement |
|---|---|---|---|---|
| 2025 | $11,819 | $1,105,600 | $605,400 | $500,200 |
| 2024 | $11,841 | $1,091,300 | $605,400 | $485,900 |
| 2023 | $10,813 | $1,081,300 | $605,400 | $475,900 |
| 2022 | $10,196 | $882,000 | $504,400 | $377,600 |
| 2021 | $4,895 | $888,800 | $525,400 | $363,400 |
| 2020 | $10,248 | $888,800 | $525,400 | $363,400 |
| 2019 | $10,426 | $882,800 | $525,400 | $357,400 |
| 2018 | $10,272 | $872,700 | $525,400 | $347,300 |
| 2017 | $10,117 | $825,900 | $525,400 | $300,500 |
| 2016 | $10,002 | $800,800 | $500,300 | $300,500 |
| 2015 | $9,730 | $776,500 | $476,000 | $300,500 |
Source: Public Records
Map
Nearby Homes
- 51 East St
- 1 Chamberlain Run
- 33 East St
- 3 Chamberlain Run
- 2 Rockwood Rd
- 6 Rockwood Rd
- 34 East St
- 61 East St
- 4 Rockwood Rd
- 36 East St
- 36 East St Unit 36
- 36 East St
- 29 East St
- Lot D Craftsman Village Unit D
- Lot E Craftsman Village Unit E
- Lot A Craftsman Village Unit C
- B Craftsman Village Unit B
- Lot A Craftsman Village
- Lot B Craftsman Village
- 1 Confidential Unit 1